
In 2018, MIT spent $731 million through research expenditures. A large portion of the money came from federal sources like the Departments of Defense, Energy, Health as well as NASA and the National Science Foundation. Within the $731M, $144M came from industry sources like IBM, Google, Lockheed Martin, Exxon Mobil, Wal-Mart, Toyota, and Capital One to name a few.

I got curious in MIT’s funding sources when Fossil Free MIT campaigned for the school to divest its endowment from fossil fuels and President Reif declined. Among the possible reasons for his decision, I wondered what MIT had to lose financially. Two potential reasons that stood out were career opportunities for students and research funding. Showing the first with a counterfactual would be difficult, and I was more interested in the second scenario. I found that the data published in the Brown Book could go a long way towards answering my question.
(The Brown Book is not a public document so I will share aggregate values, not sponsor level values on this post. See the note at the end and stay tuned for more this semester.)
While the analysis is still ongoing, here’s what I’ve found for 2017: about $720M of sponsored research funding was spent that year by the report was made. If 20% came from industry like it did in 2018, $144M of industry funding was spent. By a manual search for companies whose business is predominately fossil fuel energy, MIT spent $21.2M of fossil fuel money, or 14.7% of industry funding.
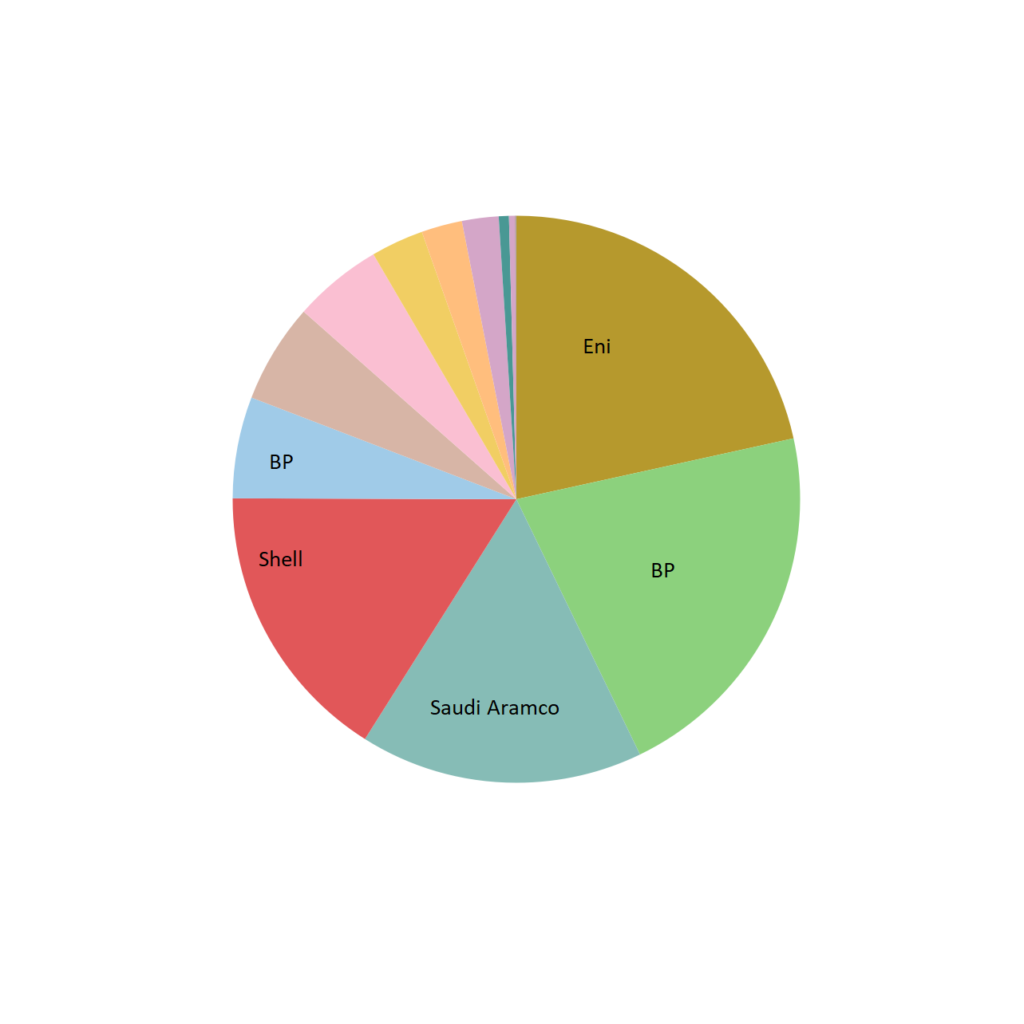
It would be a logical jump to say that 14.7% is a good or bad number. Each company has varying levels of commitment to sustainability as well as their history with acknowledging climate change. Additionally, one caveat is that although the money comes from profits derived from fossil fuels, the research may in fact be for clean energy. To find out, analysis into other documents published in the Brown Book is necessary (but hasn’t been done yet).
Other analysis I’m incorporating is look where the money flows to within MIT at the departmental (or similar) level as well as gender.
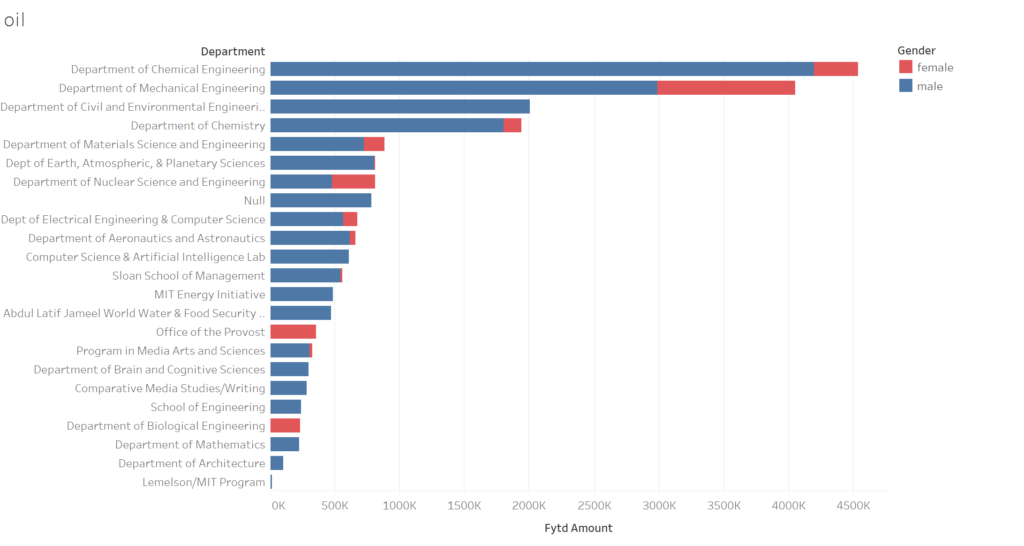
The focus of funding in the chemical and mechanical engineering is logical. The null values in the figure arise from faculty that I haven’t been able to assign into a department using an automated tool that searches MIT’s online directory. This prevents me from putting the values in the figure above into context of the respective department’s spending.
My larger goal is to create a financial transparency tool via interactive data visualizations accessible to all of MIT. I’d be curious to hear what other kinds of analysis you’d like to see or better ways to convey the narrative in the visualizations.