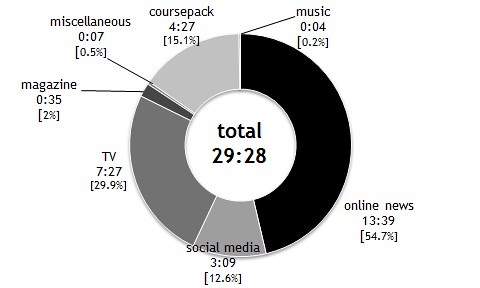
This semester, I am taking Ethan Zuckerman’s class News and Participatory Media at the MIT Media Lab’s Center for Civic Media. For our first assignment, we had to keep a log of our media consumption for a week. This is my media diet for the week of February 8-14, 2012.

Would love you to add a line or two about how you tracked the data behind the visualization. Also wonder whether it would be interesting to offer a visual comparison between the near 40 hours spent on/with media and the total hours in a week. Also, you’re evidently a serious online news junkie and may want to seek professional help… 🙂
I did it the old fashioned way: tracking my media consumption in an Excel spreadsheet and then tallying it up at the end of the week.
Yes. I know. I’m a recovering journalist.