French Patriot Act

surveillance

A few days ago, France adopted a new set of law called “Loi sur le Renseignement (“Information Gathering Act”). Despite being a very controversial law that grant extensive power to the Prime Minister and his office to run any mass and personal surveillance they want, it was not really publicly debated and little is known to the public on what they could have done to express their opinion and what they could do know to protect their privacy.

I decided to list a few resources that could have been useful to be advertised by medias before the vote and actions that people can take now that the law is in place. If there was tools to automatically surface those actions from articles and put them in front of the user, raising the action threshold may be possible. (sorry, most of the content is in French…)

It started with a first law allowing censorship on the web without the accord of a judge. Many so-call Islamic websites have been blocked and some people may have seen in France this image explaining that the website they were trying to view was blocked.

mainrouge

Action: read more on websites blocked and read testimonies of people running those websites who explain that they were not promoting terrorism at all.

Following this wave of censorship, many organizations in defense of civil liberties tried to raise the alarms.

Action: watch video explaining the content of the new bill and its potential pitfalls.

stop

When the bill seemed to get traction, a campaign of information tried to raise awareness and engage people into submitting their opinion to their local representatives.

Action: go on the website Sous Surveillance to read about the full project of law, get local representative phone number of Twitter username.

assemblee-nationale

When a project is introduced at the French parliament, they is a way for people to share their opinion and give feedback on a the bill.

Action: read the impact analysis of the bill and share feedback to deputies. For lazy people, a tweet to a members of the government could have been a first step.

manif

On the day of the vote, Monday April 13th, a public manifestation has been organized by many civil liberties organizations.

Action: take part in the manifestation.

bigbrother

After the bill was still voted into law, knowing the content and what people can do to protect themselves is the only thing left to do.

Action: watch the French Interior Minister announce that privacy is not a civil liberty, read about the vote done by only 30 deputies out of 577 or the IMSI catchers in front of Parliament during the manifestation, learn about VPN and SSL to protect privacy.


Posted in All

Twitter curation, not so easy…

After the last class I was still unclear what to think about Twitter and social medias as a way to report news. I was not a big Twitter user and this class made me use it more. I was curious to investigate more and see how good Twitter was to report on some heated subjects where having someone on the ground could be either difficult or could bring significant value and truth. After searching a few hashtags, I found it was virtually impossible to take anything for true unless methodically searching for clues on the veracity of the tweet. Also, many tweets were a vessel for articles and pictures and opening each content was sometime a mess. I thought through a few actions that could be useful to curate tweets and get a larger picture and tried to build that into a simple tool.

This is still more of an example on what could be done than something ready for daily usage but I tried to get a sense of what a curated twitter feed could look like. Being able to search for a subject, get translation (non-latin characters are still an issue in my tool), get attached pictures and article right at the same place, get past tweets of the same user, know his location if available and do a reverse query on attached image to know if it was already present on the web.

The work in progress can be found HERE, let me know what you think and I will continue to improve it as the time constraint didn’t allow me for more advanced features and a bug-proof solution yet.

Michael’s digital identity or virtual reality

I did what I think many of us did when starting this assignment.

I started opening tabs and tabs and tabs when I mistakenly clicked on the “Images link” on top of my window and discovered various shots of Michael. I wonder, would I know Michael if I saw pictures of him or read what other told about him. Does the web encapture who we are through quotes and snapshots of our lives or is it just a nice story book.

This pictures was taken a few years ago in Nashville, Tennessee where Michael went for a concert with his good friend Jessie. He had won two tickets to go see and hear Yo-Yo Ma play with the Nashville Symphony Orchestra. Other than the fact that Yoyoma “played like he had a demon inside him and that he was releasing it through the tip of his bow”, this picture is also used as the face of Michael on numerous websites such as LinkedIn and Twitter.

Michael first encountered Twitter through a high school class on media in the 21st century. After exploring this new form of media, he could not figure out a meaningful way to use it until a few months ago when he discovered the importance of Twitter in the media world. Twitter happens to be a great tool for surfacing information on subjects that Michael likes and follows but also for networking purposes. He discovered that Twitter acts a bit like a “social currency” amongst journalists. Following someone or being followed are not traded lightly in an industry where validation of peers seems important.

Look at that smile! This one was taken during Michael’s senior high school year as part of all the pictures taken for the YearBook and other internal school publications. This picture is actually the journalist face of Michael. It was primarily used as profile picture for the New-York Time blog. Michael wrote articles for the New York Times between March and June 2010. He was among 6 students who were selected to write about their college admission process in the NYT blog.

Michael journalistic interest did not start at the New York Times. He was Co-opinion and then Co-editor of his high school newspaper. He really enjoys writing and despite not being ready to commit to journalism, he knew that he was not done with it either. His take on this experience at the New York Times: “crazy”, “bizarre” and “fascinating”. He was impressed that so many people were invested in his story, and yet that the journalist’s work creates a “layer of abstraction” that put some distance from the reality of the people in the pieces and ease to write about anyone.

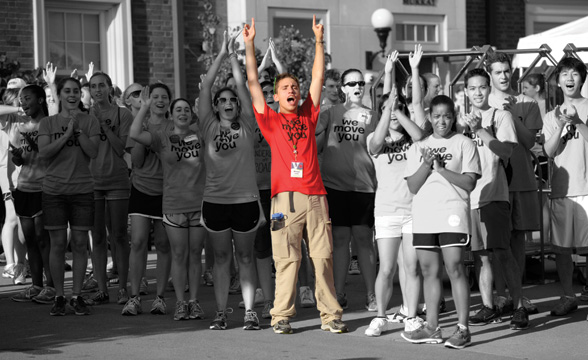
This third one is a treacherous one: the picture was edited and used in a very different context than the actual one in which the picture was taken. Let’s talk about the picture first. This was taken in sophomore year at Vanderbilt when Michael was “Vuceptor” Vuceptors are the older students dedicated to helping new students and their parents settled so they don’t have to lift a thing.

The trick here is that the picture was trimmed and Michael was put in the for front. Instead of seeing the load of other students helping and the queue of cars with parents eager to get their offspring settled in, the picture was edited and linked to a piece on the Vanderbilt blog talking about the One who chose Vanderbilt over Yale a few years ago and its evolution at Vanderbilt. Michael knows this is mainly because “Vanderbilt was excited I had picked them over Yale” but this piece, following the story the NYT started on him, was really “disconnected from the reality” and deciding for “college gets too many people stressed”. The one thing Michael wants us to remember from this picture is that “he was happy to be at Vanderbilt”.

Lastly I asked Michael about this picture. He remembered most of the context. This is an extract of a Vanderbilt TV coverage of an annual concert organized in Nashville for students. This particular concert was in 2012, Archives Nights were playing. Michael remembers a “great concert” and the 4 members of the band “were good”. He confessed that he had tried to organize a similar event to promote the band and it ended up being “a terrible event that he had tried to plan”.

After all of this, I asked Michael if this glimpse of what could be found on him on the internet was a good representation of who he was. He paused for a while and admitted that it was “incomplete”. The public content is mostly “polished and professional”, more of a “candid shot” and that none of the pictures or the articles attached were “capturing the true sense of everyday”. For him, his Facebook profile would give a better representation of who he is but even a privileged access on his social media profile would still not do the trick.

Most pictures present have been posted by friends rather than himself. An interesting thought crossed my mind. The absence of pictures of Michael was perhaps more representative of him than what you could actually find. After sharing this thought with him he concluded: “In a lot of sense I’m boring. I don’t put myself in position where people would take picture and I would be embarrassed in they posted them online”. This struck me. First, it would mean that not ending on Facebook in some weird half-naked outfit is boring. Second and more importantly, you obviously don’t end up writing for the New York Times or studying at MIT by being boring. Maybe there is more to it than meet the eye and the digital world is far from being mature to represent lives and share experiences.


PLACES Journal finds its way back to MIT

PLACE
noun
plural: places
  1. a particular position or point in space.
  2. a portion of space available or designated for or being used by someone.

This new exhibit at the MIT Museum has the purpose of reminding us of the second part of the definition: places are there for people to use, interact in and transform into incredible and wonderful sights.

Founded in 1983, Places Journal has tried “to see places in new ways” as the editors wrote, and this exhibit offers us a glimpse of those new ways of seeing places around the world.

Since the Journal was co-founded by an architecture faculty at MIT and the University of California, Berkeley, it seems only logical that after 32 years, MIT Museum would display some of its more relevant pieces.

21 photographers, from the famous Joel Sternfeld to Maria Cox, give us a new way of apprehending places where people live and feel. A lot of the photographs in the exhibit present New York places but don’t worry you will also encountered very unknown place such as Kyrgyzstan sights from Margaret Morton for example.

Enjoy a small preview in the exhibit by clicking the link below. New ways of showing the world deserved a new way of displaying quotes and a few pieces present in the exhibit.

TAKE ME AWAY!


The exhibit will run until August 16, 2015.

MIT Museum – 10am 5pm – http://web.mit.edu/museum/
Places Journal Website: https://placesjournal.org/


  • 1:30 – 2:45 : Museum
  • 3:00 – 4:00 : Photo treatment
  • 4:00 – 5:15 : Post publication

Media consumption, what a mess

Before I started recording everything I thought I was a very predictable creature of habits. Two snow storms and 12 days later, this is not that clear to me anymore. There are still some evident truths: I spend a LOT of time not only staring at my computer but also typing, gesturing, scribbling, coding, reading,… on it.

  • Here is what I did: I recorded all my browser activity during 12 days. I choose to do the media diary like this for several reasons:
  • the computer and specifically my browser is where I spend most of my time consuming media
  • I use my phone a lot to get notifications but unless I am on the go which was rare those past days, I read and interact with those on my computer
  • getting consistent and reliable tracking is possible on the computer
  • finally, my browser reflect best what I am doing as I do most things in there anyway (except watching movies and series which I recorded separately, and they amount for a total of 9h30 of movies and 8h40 of TV series)

That’s the why, here is how.

Found a Chrome extension that records some time stats then modified it to get more granular and accurate record to be able to see when a webpage is not only open but I am active on it (reading, scrolling, clicking, typing,…). And then took all of this data and created some nice graphs. You can find all the interactive graphs HERE if you want to play a bit more with the data.

Here is what I found interesting:

  • I spend a lot of time on that thing. Keep in mind that all the numbers are time active so when I am interacting with the computer. It doesn’t count all the gaps of attention or loading times. Compared to the 18h10 spent watching movies or series, I find this almost reassuring that I spend three times as much time being active and productive on the computer).

ck_time-aggregated

  •  I spend most of my time on Facebook or coding. This might be explained by the fact that Facebook is now my primary mean of communication and also that coding is what I do for fun.

ck_stats

  • Regarding my news consumption, I got to record what I thought originally: most of my news sources are from social media except the very few news website I visit on a daily basis. I even looked at twitter to get a general sense of news instead of drilling into full articles when the subject was not important enough. If Facebook is opened and active most of the time, many other actions are pretty random during the day, but news reading occurs strictly if there has been some intense activity on my social media walls.

ck_fb_news

  • Finally, I looked at the actual active time to see how productive I was and which websites were captivating most of my attention. The colors speak for themselves, even if I check news websites, I spend more time on Facebook or on my email in those single period. My activity is a lot of multitasking and my attention is very unfocused, on the computer but also with things outside of my computer (I am at most 35% focus on any browser activity at a given time).

ck_attention

 Thank you for taking the time to read until here and once again feel free to play with the graphs HERE.