Reflective Ways to Engage with Rural USA: A Case with Devon

After 2016 and in the whirlwind that is our current political system, liberal America has gained a new fascination with rural and conservative America, and it can be unproductive. We look at rural America under a microscope, travel through as if we’re in a far away land, and marvel as we observe how culturally different we are from them, how far away we are isolated in the city and in universities, and the poverty that has stricken shrinking spaces as if it wasn’t intentional or a direct product of capitalism and other systems.

However, Devon Shapiro approaches rural America with a more empathetic lens. He explains his reasoning for why he looks to rural and conservative groups, “I’m interested in politics and interested in thinking about what role I can play. At least in my lifetime, the political system feels crazy. What role I might consider playing in that?” And as someone from rural-conservative spaces, what is the best role to play in these spaces?

In an effort to understand his role and participate in the unruly political sphere, Devon went back to where he grew up in a semi-rural town in Ohio to canvas for Danny O’Connor in the special election.

He tells a story of this experience: “I consider myself progressive, I vote for democrats. I met a lot of people that would say, ‘you know what I care about it my children getting good jobs, social security, and you know, whether medicaid and medicare are going to be there.’

And, you know, I’d say, ‘Well, I’ve got a good idea for you, you should vote for Danny O’Connor!’ But they didn’t see it that way.

They weren’t really sure… they’d been republicans their whole lives. A lot of people wanted to talk about 2016, and they would say between those two candidates, this is a direct quote, ‘Do you want me to stab myself or shoot myself?’

I didn’t want them to do either of those things!

And I thought this was kind of this crazy, defeatist, nobody in politics cares about me, has my best interest at heart. Like why is someone so disaffected but can clearly articulate that they care about medicare medicaid social security, things that clearly the democratic party has become their issues.”

While recounting his experiences canvassing, Shapiro referenced The Politics of Resentment, a book by Kathy Cramer discussing the growing urban-rural divide in the US. In the book, Cramer explains a recurring pattern she hears while interviewing and speaking with folks throughout rural Wisconsin. People keep saying, “ I don’t have any evidence, but this is what I think.” This word of mouth reinforces already held beliefs in the communities through echoing feedback loops.

A key question Shapiro grapples with is how do we give those people that data? Or, rather, is thier perhaps lack of interest in data a function of the human condition?

In liberal spaces and especially in academia, we take data, rigorously acquired, to be the word of God. Yet, we forget that in other spaces, in rural and conservative spaces, the word of God is still the word of God, or at least as Devon found, something else reminiscent of it.

While in school, Devon became fascinated by the apparent contradiction that was rural evangelical protestant capitalists. He explains, “if you read the bible, ‘protect thy neighbor,’ like if you had to go from the bible to a government economic system, for sure you would go socialism. The question became, why do people who literally think the bible is the word of god, take it literally, how in the world do they support neoliberal economic policy?”

From this question, we began to dive into “What’s the Matter with Kansas?” an infamous book that found, basically, that rural voters do not vote in their best interest. The author, a journalist, argued that though a democratic candidate will offer agricultural subsidies, the farmer will still vote for the republican.

Devon explained the critique of the author, “You, Mr. journalist, can’t make a value judgement on why someone votes the way they vote. They have things they care about and vote on what they care about. Clearly these people in Kansas care about things that aren’t agriculture subsidies. And clearly you think they should care about the economy or what you care about but they don’t.”

Some of the liberal fascination with rural America is frustrating, for we can use it as a way lump an entire group together and speak of them as if they are all ignorant. ”They don’t look at data? They don’t prioritize economic interests? Not smart.” It can be annoying because we can so easily name their voting habits as a moral failing, an act of ignorance, not a reflection of something else. Therefore, we act as if the voting separation is a result of us (liberal leaning folk) being good and them (conservative or rural) being bad people, not something much more complex and nuanced. We have begun studying these rural spaces and doing the work to understand how different (and similar) they can be from spaces at MIT and in Massachusetts, yet we still offer rural spaces the same language of data assuming it will have the same effects on rural folks as it does with liberal people.

I’m not advocating to not use data. But as Devon questioned whether this was something we should be trying to get rural folks or not, I think we need to reflect and approach rural spaces and people with understanding, respect, and intentionality. To do anything less would be disrespectful to them, but also an absolute disservice to those trying to organize social and political movements against Trump who have potential allies in rural disgruntled communities.

Some of my frustration stems from the condescending tone that some folks in white, liberal, northern spaces can take towards those in rural, conservative spaces. We often hear how these folks dehumanize others, are racist, and are ignorant. Perhaps this is true about some, but it is also true about people in liberal cities. Boston can judge those in the south for being explicitly racist, but those in the north are covertly so, segregating cities, participating in harsh crime laws, all under the guise of being allies, and then judge rural communities for voting based on their values rather than data. Post Trump election, spaces in the urban north observe these rural spaces under a microscope and wonder why they don’t think in the right way. Yet, they have honesty and transparency about their values and act in line with them, a trait that not all liberal spaces carry.

For these white liberal people, I believe as a first step, it can be helpful to break down the assumption that the way people in liberal spaces think is the right way. I think understanding and respecting the ethic and approach of rural and conservative America is a second step. Devon finished with a simple summary I valued: “[I’m] fascinated by this apparent contradiction. These people don’t think the way I think they should think, but they aren’t dumb. There is a logic to it. And I might disagree with that logic, but it is about appreciating that and understanding that.” Of course, we shouldn’t accept racist and dehumanizing views. Yet, understanding why they hold these views can help inform next actions and steps to create positive change within rural spaces.

The shape of the clean meat industry

I made a story about clean meat on Graph Commons that you can check out here. It’s a bit light as an explainer piece as it took me a while to find a decent, online graph maker.

Graph Commons is a relatively intuitive tool to use. While I was excited about the speed at which I could build the graph, I quickly noticed difficulties between what I envisioned and what this tool offered.

  • It’s difficult to create clustering based on your choice of features e.g. food product or investors
  • Nodes have categories, the highest level of grouping, and properties which can provide additional information. You can’t color nodes based on their property.
  • Their story feature is shaped around slides and zooming in on sections of the graph. You can’t have a story where the graph is built (through animation) alongside a main body of text. A good example of this would be fold.cm where the media supports the text.

Still, Graph Commons may be a good tool to draft a graph and export the data to a more customizable tool.

On the general idea of incorporating graphs into storytelling, it’s much more feasible to have it manually authored rather than computer generated. Although the most useful form of the tool might be a browser extension that generates a graph as you read an article, that’s difficult. Automatically generating graph networks based on text is an ongoing (read: unsolved) research field for knowledge representations in artificial intelligence. On the hand, having the author create the graph and its animation alongside the article is a natural extension of curating a story into an article, creating a graphical structure alongside a textual one. The trade-off is that requires more work on the author’s part. This additional work may be offset if the author considers it a valuable tool to use while they’re crafting the story.

The decline of the Arab-Jewish Population

This week, I came across an opinion piece titled “The Moroccan Exception in the Arab World” by Yaëlle Azagury and Anouar Majid. This article focused on the revival and restoration of Morocco’s Jewish heritage through the policies of King Mohammed VI. The authors’ main argument is whether the revival is symbolic or an intentional endeavor by the country to revive its declining Jewish population. Given that the existing Jewish population in Morocco has dwindled from around 250,000 in the 1940s to around 2,400 citizens today, the authors feel that the symbolic aspect of these policies is more dominant.

What are the reasons for this drastic decline?

First, we need to acknowledge that this decline is prevalent in all the Arab countries in the Middle East and North Africa. This phenomenon was triggered and accelerated by the Arab-Israeli War of 1948. The aftermath of this war led to significant casualties on both sides, 700,000 Palestinian Arabs fled or were expelled by Israeli forces, and Israel annexed 22% more than the UN Partition Plan had allocated. The strategic losses incurred by the Arab countries involved in the war, the growth of nationalism among Arab nations, and the establishment of Israel as a Jewish state and a homeland for Jewish people were all factors that contributed one way or another to the Jewish exodus from Arab countries.

It is hard to estimate the exact numbers of Arab Jewish citizens who have fled their respective countries, but it is estimated that around one million Jews in North Africa and the Middle East left their homes in the decade after the creation of Israel.

I used several data sources, including the data published by the Israeli Ministry of Foreign Affairs to create a visual that gives a better perspective of the exodus of the Arab Jewish citizens between 1948 up until 2005.

The most significant decline in the Jewish population took place between 1948 and 1967. The Six-Day Arab-Israeli War of 1967 was another trigger that made it almost impossible for Arab Jewish citizens to openly identify their religion due to the growing hostility against Israel. Many Arab states utilized their nationalistic agendas to represent the Jewish Arab population as a population that is more loyal to the Israeli Jewish homeland than to their respective countries. Policies were drafted to alienate and isolate the Arab Jewish population. These policies varied across the different Arab states, but they included: imposing specific restrictions on Jewish businesses and associations, limiting religious practices, subjecting the majority of the population to procedural harassment and continuous surveillance.

These circumstances may help us understand the significant decline of the Jewish population in Arab states. Many Arab Jews were also attracted by the prospects of living in a Jewish state that embraces their Jewish identity.

What happened beyond 1967?

The decline between 1948 and 1967 was so severe that the subsequent exodus of many Arab Jews beyond this period may be considered trivial. It has also become extremely hard to identify the Arab Jewish citizens who are still living in Arab countries due to the lack of public census data that identifies them. The remaining Jewish citizens are also less comfortable in publicly identifying their religion due to fear of harassment from both public and state actors.

Restorative Justice and Circle: An Explainer

In response to the United States’ crises of mass incarceration, the “school to prison pipeline,” and the racial disparities that can lead to incarceration, many teachers, academics, and activists are calling for alternative systems of discipline, or alternative systems of addressing harm in the classroom. In that effort, “Restorative Justice” (RJ) has become a popular topic that continues to pop up in legislation, experiments and programs in schools, and within prisons. But you may wonder, what does RJ entail? And how is it different than our current justice system?

In this explainer, I’ll show the difference between retributive (or punitive) and restorative justice, how restorative justice is practiced, as well as its limitations, reach, and impact globally.

A Brief History

At the core of their values, the United States, most Western nations, and victims of colonization and invasion define justice as retributive and punitive. To reach justice, punishment must be administered to the offender. “An eye for an eye” is the mantra of retribution, not a warning against it.

However, it has not always been this way globally. The indigenous peoples of North and south America, Africa, and beyond (evidence of practices reminiscent of Circle are found even in some european indigenous communities remains) respond to  harm done within their communities through restoration, not necessarily retribution, through community dialogue and discussion, one practice of which we call Circle.

The Circle practice the groups in Boston practice is most similar to the Plains Peoples of North America. In the 1990s, in response to experiencing their own incarceration crisis created by the Canadian people, First Nation communities sought alternatives to the punitive justice system of Canada that was disproportionately incarcerating Native people, and brought forward Restorative Justice and Circle practices.

What is the difference between retributive and restorative justice?

Adapted from Fraser Region Community Justice Initiatives Association

Fundamentally, the difference between a retribution (or punitive) and restoration model is where our community puts the focus after harm has been caused. After some harm in retributive justice, the emphasis of the responding party is placed on the perpetrator: what rule did they break? How do we punish them?

The response focuses on establishing blame and making the community prove the harm happened. Justice then is achieved in the familiar model of trial by jury, establishment of guilt, and then delivering the proper punishment that’s gravity, it seems to those delivering it, fits the crime.

In restorative justice, on the other hand, the person or group responsible for responding will focus on the survivor of the harm and all those affected: what do they need? What does their family need? What will help them overcome this challenge or harm?

Restorative justice does not see harm as simply broken rules, but people hurt and relationships damaged. It inherently looks at the community and the impact of the harm more holistically, where punitive justice can look at only two actors. After understanding the needs of the person harmed, justice is not necessarily sought through proving the person committed the crime, but rather through community dialogue, understanding, and reparation.

Then, justice is seen to be achieved when 1) people take responsibility for their actions,  2) people’s needs are met, or 3) healing of individuals and relationships occurs.

After a more punitive response, it is difficult to attain full acceptance back into one’s family, school, or community without a stigmatized label attached. One mission of restorative responses is to maximize the possibility of full acceptance without that label and with healing for all parties involved.

What does this look like?

So there are these great ideas of other ways to know justice, but it is unclear how to execute them. Luckily, groups like the Suffolk Center for Restorative Justice, the Harvard Divinity School Religion and Practices of Peace program, Restorative Justice for Oakland Youth, and many others nationwide offer trainings on Restorative Justice Practices, some of which I was lucky enough to attend! And in those trainings, my fellow classmates and I learned to keep Circle.

To begin, there are multiple kinds of Circles, including those to simply build community and trust, and those to address harm. Each Circle is unique and must be adapted and edited to meet the needs of the situation and the group. *As a disclaimer, this is not an endorsement to practice harm Circles, and you should not without training.*

Circle is the process that facilitates community dialogue and understanding that enables  reparations and healing for justice to be reached in a restorative way. To do this, a keeper (or facilitator, the words are used interchangeably), speaks with all parties affected individually. While speaking with the parties (and identifying that no further harm or violence will come from the circle, that the parties all acknowledge wrongdoing in some way, and that all parties are willing to be there), she invites them to circle.

With a group of ideally about 15 sitting in a circle with no tables between them, and a centerpiece (often a circular cloth, a plant, some water, a candle, and rocks to represent earth), the keeper will open the circle. To ceremonially begin sets the tone of the space, grounds the group, and puts the participants into the Circle mindset.

Then, the Circle begins. If is the group’s first circle, they collectively decide on values and guidelines for how the circle goes. The facilitator will then start with prompts she asks the group. She can start and answer the prompt herself, setting the tone for Circle, or pass along the talking piece for someone else to start first. Each Circle has a talking piece, an object that grants the holder the ability to speak. While someone has the talking piece, everyone else listens. This enables each person to feel as if they have a voice that is valued, and that they have the ear of their community who will listen to and absorb their stories and concerns.  

Sometimes (quite frequently), holding the Circle, hearing the person who caused harm admit to causing that harm in front of the community, can be enough for the person who was harmed and their people to be satisfied and require no further action. Other times, the group will come to the conclusion that more action is needed, more Circles must be had, or reparations beyond dialogue are necessary to enable healing.

But aren’t there limits?

When I first began engaging in the restorative justice space, I always believed there to be limits. I would think, “I couldn’t get in a room and hold Circle with someone who killed someone I loved” or “sexual abuse and sexual assault are beyond restoration.” I knew this process was not for all crimes.

However, Sujatha Baliga, the Executive Director of the Restorative Justice Project at Impact Justice (a national innovation and research center focused on justice reform) has built her career on the foundation that there are no limits for the types of acts that can be forgiven, from abuse to murder.  

She tells her own story of experiencing relentless sexual abuse as a young person, moving through life carrying and motivated by a deep anger, and how she experienced transformation through forgiveness in this interview. Initially motivated to lock away all sexual abusers, now she advocates for and deeply believes in the power of restorative justice, Circle, and forgiveness to heal those who have been harmed and those who have harmed.

However, addressing a different restriction, there are limits to what one person can hold. It could be incredibly taxing and emotionally damaging to the facilitator or keeper to listen to trauma and pain on one-on-one discussions over and over. Yet, in Circle, the facilitator is decentralized, and the trauma, pain, and harm expressed is not held by one person, but by the group. This decentralized group listening removes the bulk of the burden from the keeper, and distributes it throughout the Circle in a way that enables healing for all through listening, empathy, and support as well as a strengthened bond through intimate experience shared openly.

Are there other applications?

Circle does not need to be only held when harm occurs. For example, in this video shown at RJOY’s training, you can see after harm, a young man uses Circle to re-enter school. In another shown by Suffolk Center for Restorative Justice, the process builds community and trust between participants and acts as a apparatus of support. Circle has been even practices among youth as young as kindergarten. The goal is not only alternative forms of justice, but also to enable social emotional learning in students and develop trust and support within a community.

Does it really work?

Yes! New Zealand has found success implementing restorative justice in their juvenile justice system, completely transforming the process, dropping their youth incarceration from over 6000 children and young people yearly to less than 2000. While the US government did not find large reductions in recidivism or expulsion, individual schools have found success with Circle and RJ practice, almost completely eliminating expulsion and greatly reducing suspension rates.

But why does it matter?

As the inspiration for this explainer touches on, the criminal justice system in the United States is horrific, dehumanizing, and racist among many other things. It is unbelievable an institution like this exists and that we stand for it (until I remember the crimes we commit daily, the water in Flint, children in cages, etc…). As we push forward with a retributive justice model as a society, we perpetuate that dehumanization of incarcerated folks, which because of racial disparities as Michelle Alexander explains, ends up looking a lot like a thinly veiled re-incarnation of slavery.

Often an afterthought, juvenile justice in the US looks similarly dismal. The School to Prison Pipeline becomes more deeply ingrained into our society, it is essential to re-assess the values that define the systems we build, and search for and implement other, equitable, restorative-over-punitive systems to transform our justice system, to remember that “an eye for an eye makes the whole world blind.”

Information from Living Justice Press, Restorative Justice for Oakland Youth

Explaining West Virginia’s Struggle

The legacy of coal is important in understanding the future of Appalachia. Coal taken from West Virginian (and other Appalachian) mountains almost literally powered building the industrialized United States. While mines were operational, miners largely earned living wages, joined strong unions, and achieved a middle class life. However, coal today makes up a far smaller portion of American energy consumption than 50 years ago, and many of the geographic areas producing coal are now poverty-stricken and suffering from public health crises ranging from opioids to smoking to obesity. In thinking about why this is the case, it is important to keep a few facts in mind:

Most coal mines were located far from established towns, which led miners and mining companies to build towns in more convenient locations. These included cheap homes, a company store, and a church. Rather than bringing the banking system to the miners, mining companies generally paid miners in “coal scrip,” a simplified system in which miners could exchange the scrip tokens for goods at the company store. Though convenient at the time, this system created generations of miners and families that lacked financial literacy and were excluded from the modern financial system.

Coal mining is hard. Ranging from respiratory problems (e.g., black lung) to chronic pain, there is no doubt that miners themselves paid a physical price of walking into mines every day. But coal by itself does not explain the opioid crisis. While true that there is evidence that substandard working conditions can lead to addiction, and over-prescription of opioids should not be overlooked, a more comprehensive view leads to a “disease of despair” explanation for the West Virginia opioid crisis. So we should think about education, obesity, and poverty (to name a few) as part of a system that creates economic and social disadvantage that helps explain the severity of the problems in West Virginia.

Regional differences in West Virginia are important. Coal production in Southern West Virginia decreased approximately 70% (from 130 million tons to 40 million tons) between 2000 and 2017. Yet for Northern West Virginia, production actually modestly increased from just under 40 million tons in 2000 to just over 40 million tons in 2017. To explain this, we can note a few important factors: first, to the extent there is other industry in West Virginia, it is located in the Northern part of the state (primarily logging and shale gas mining). Second, the Northern West Virginia is geographically less remote than the Southern part: the “Eastern Panhandle” arguably benefits from Washington D.C. spillover effects and the “Northern Panhandle” includes suburbs of Pittsburgh (commuters drive for less than an hour). These regional differences manifest in demographic and public health statistics: Southern West Virginia shows worse public health outcomes, has lower median HHI, and lower life expectancy than Northern West Virginia.

West Virginia has historically not invested in public education. Despite modest gains based on the successful 2018 teacher strike that resulted in a 5% raise (and catalyzed teacher strikes in numerous other states), West Virginia remains significantly behind on public education. West Virginia ranks last in percent of population with a bachelor’s degree (a shade under 20%) and 49th in percent of population with an advanced degree (7.9%). West Virginia teachers went on strike again in 2019 protesting a state bill privatizing public education despite the fact that if passed teachers would have gained an additional 5% raise. Structurally, this investment stems at least partially from the lack of education necessary for coal mining jobs: historically, many West Virginians sacrificed formal education to enter the mines.

As an employer, coal has not been replaced. Today, Wal-Mart is the state’s second largest private employer, Kroger the fourth, and Lowe’s the seventh. The rest of the top ten include five hospitals, Mylan pharmaceuticals (generic drug-maker), and Res-Care (Kentucky-based company providing in-home services to people with disabilities). Notably, there is not a single energy company on this list. It is hard to find longitudinal employment statistics, but just since 2005, coal industry employment has dropped approximately 30%. The number since the height of coal production (e.g., 1950) would almost certainly be far more staggering. It is also important to note that West Virginia is not the only state impacted by the decline of coal: of the top ten coal-mining companies in the US ranked by production per year in 2014, the first, second, fourth, and seventh (representing 44.2% of total 2014 coal production) were bankrupt by 2018.

State government has historically promoted pro-business policies that helped coal companies thrive. Specifically with regards to environmental protections, West Virginia has been on the forefront of deregulation. Though a cherry-picked example, it is almost unbelievable that weeks after a chemical spill at a coal refining plant spilled 10,000 gallons of chemicals into the Elk River leaving ~300,000 people without potable water, Democratic governor Earl Ray Tomblin warned the Obama EPA of “unreasonable” protections.

Research Funding at MIT

In 2018, MIT spent $731 million through research expenditures. A large portion of the money came from federal sources like the Departments of Defense, Energy, Health as well as NASA and the National Science Foundation. Within the $731M, $144M came from industry sources like IBM, Google, Lockheed Martin, Exxon Mobil, Wal-Mart, Toyota, and Capital One to name a few.

I got curious in MIT’s funding sources when Fossil Free MIT campaigned for the school to divest its endowment from fossil fuels and President Reif declined. Among the possible reasons for his decision, I wondered what MIT had to lose financially. Two potential reasons that stood out were career opportunities for students and research funding. Showing the first with a counterfactual would be difficult, and I was more interested in the second scenario. I found that the data published in the Brown Book could go a long way towards answering my question.

(The Brown Book is not a public document so I will share aggregate values, not sponsor level values on this post. See the note at the end and stay tuned for more this semester.)

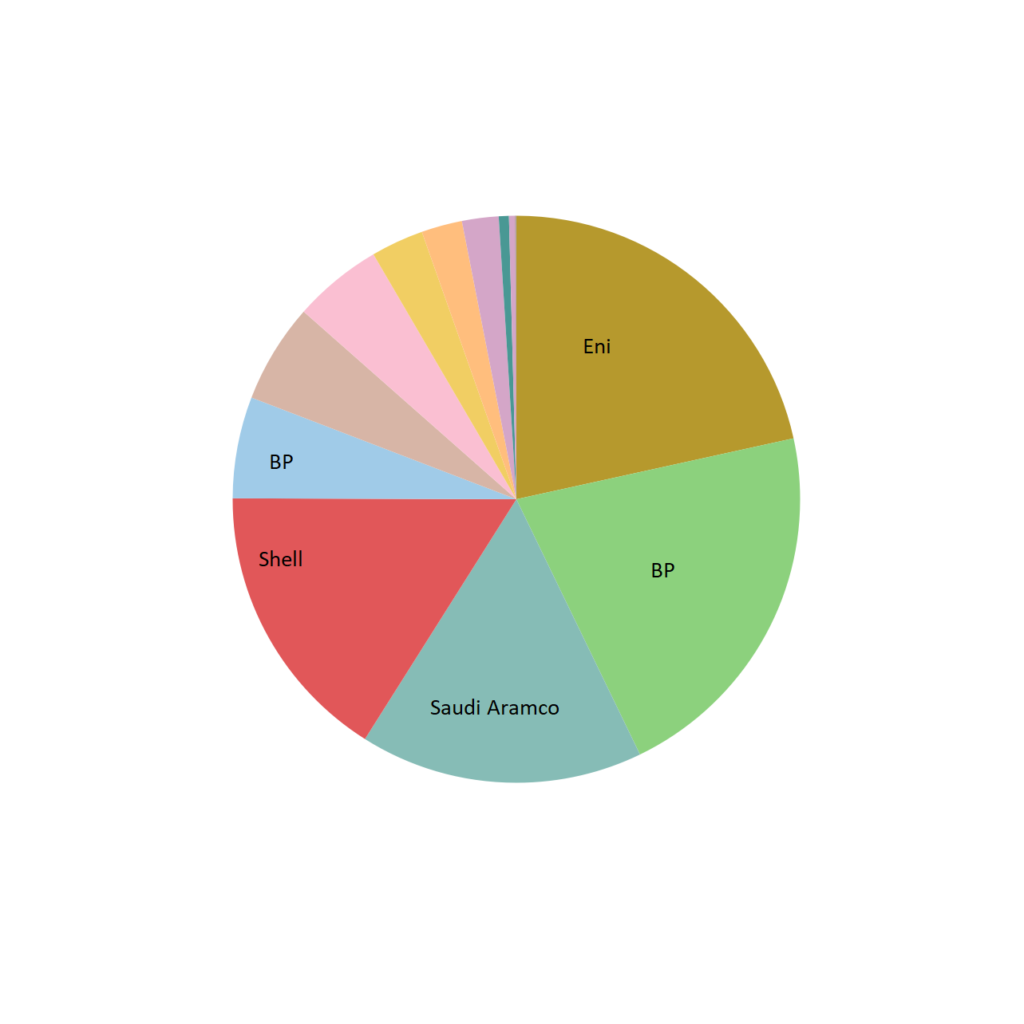
While the analysis is still ongoing, here’s what I’ve found for 2017: about $720M of sponsored research funding was spent that year by the report was made. If 20% came from industry like it did in 2018, $144M of industry funding was spent. By a manual search for companies whose business is predominately fossil fuel energy, MIT spent $21.2M of fossil fuel money, or 14.7% of industry funding.

Total pie area represents approximately $21 million.

It would be a logical jump to say that 14.7% is a good or bad number. Each company has varying levels of commitment to sustainability as well as their history with acknowledging climate change. Additionally, one caveat is that although the money comes from profits derived from fossil fuels, the research may in fact be for clean energy. To find out, analysis into other documents published in the Brown Book is necessary (but hasn’t been done yet).

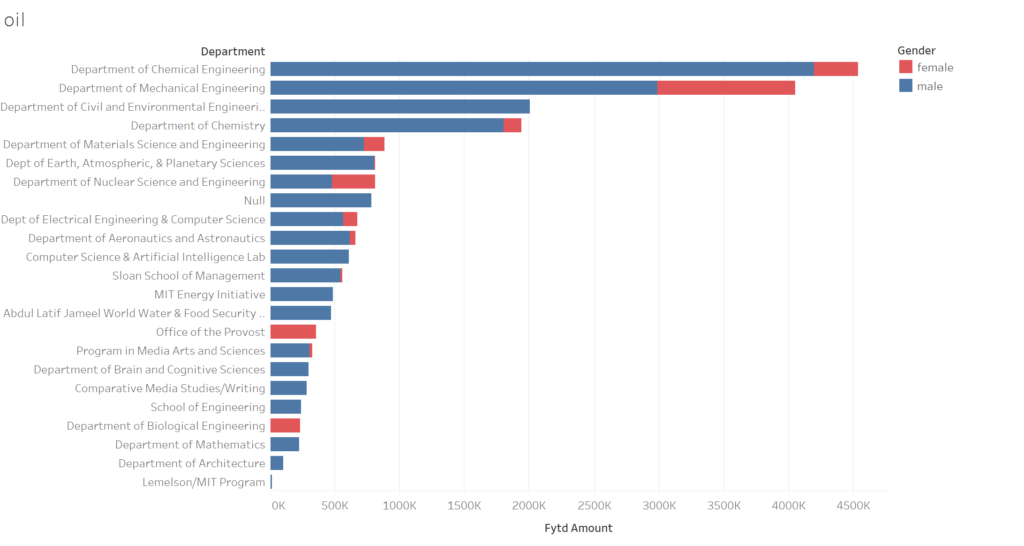
Other analysis I’m incorporating is look where the money flows to within MIT at the departmental (or similar) level as well as gender.

Made in Tableau

The focus of funding in the chemical and mechanical engineering is logical. The null values in the figure arise from faculty that I haven’t been able to assign into a department using an automated tool that searches MIT’s online directory. This prevents me from putting the values in the figure above into context of the respective department’s spending.

My larger goal is to create a financial transparency tool via interactive data visualizations accessible to all of MIT. I’d be curious to hear what other kinds of analysis you’d like to see or better ways to convey the narrative in the visualizations.

Health and Wealth in Singapore

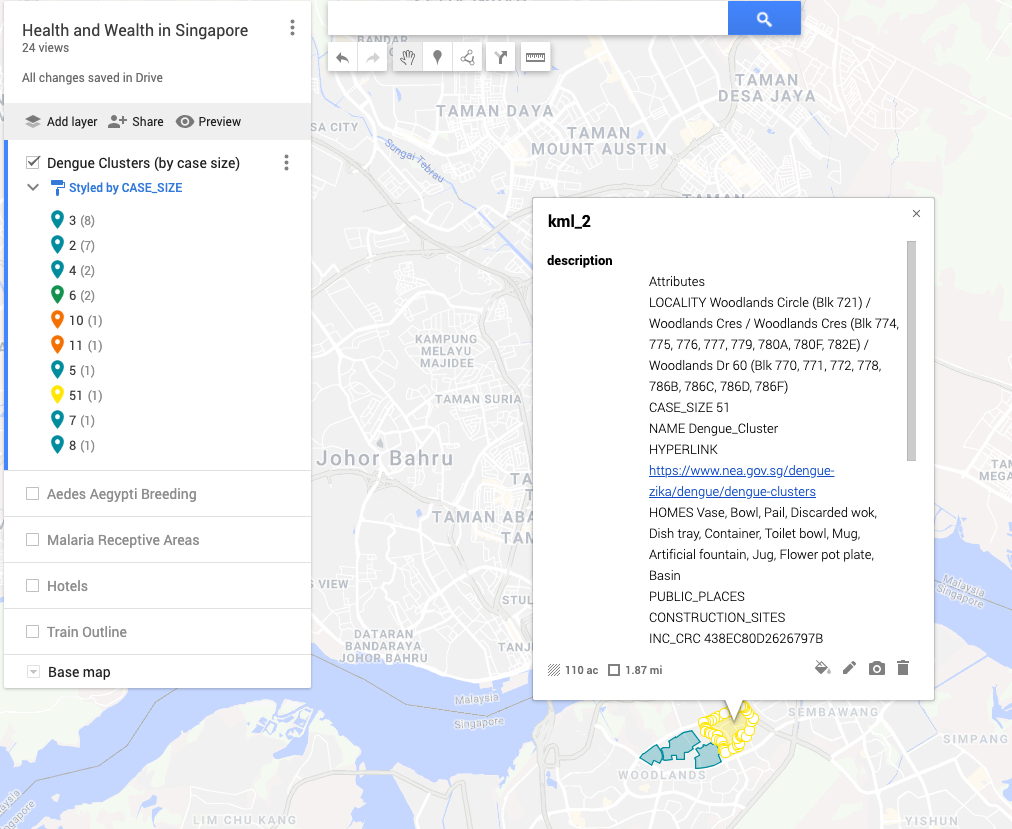
I approached this assignment with a data-first, narrative second perspective. I work on developing strategies for combating vector-borne diseases so the allied fields of epidemiology and geography seemed like a promising place to look for a story. One of the major vectors for diseases that affect humans (i.e. Zika, dengue fever, malaria, chikungunya) is the mosquito. There are several different kinds, but for the most part, they share a common taste in habitat. Places that are close to water, particularly stagnant freshwater, and get warm (as low as 60F, but ideally 70-80+ F) As I poked around the web trying to find workable datasets with this in mind, I came to find well-indexed mosquito and vector-borne disease maps from Singapore, provided by the government. I used Google MyMaps to create layers on this map that you can use to toggle between the overlays and I’ll walk you through some of the highlights.

One of the first things to know about Singapore, from an epidemiological perspective, is that it’s dense. There are over 5 million people living in an area under 300 square miles. Its the third most densely populated country in the world. While its very prosperous, it also faces a high level of income inequality — more unequal than the US and on par with Equador and Saudi Arabia (according to its Gini coefficient).

There were over 3000 cases of dengue reported in Singapore in 2018 an while the government maintains a high level of engagement in managing mosquito populations, the problem remains endemic. The National Environment Agency provides records of the location and number of reported dengue cases over a 14 day cycle, the last of which ended on November 7th, 2018.

This is a heat-map of the clusters of dengue fever in Singapore. The areas that are blue-green are clusters in the single digits and the double digits are in orange and yellow. We can see that cases not evenly distriubted throughout the country and most clusters are within a mile of another cluster.

Zooming in on the largest cluster, with 51 cases (just under half of the total of all sites), we can see that the areas of stagnant water (where mosquitos breed) were found exclusively in homes. Water collects in every-day, household-objects, as is does in public places and construction sites. It seems personal homes, perhaps due to lack of knowledge, are the entry point for the spread of the disease. This is a question we can explore further by looking at where the breeding sites for aedes aegypti were found in the graph

Overlaying the aedes aegypti breeding sites with the dengue clusters, something interesting pops up — the graphs don’t match. While there are breeding sites in areas that there are clusters, there are not clusters everywhere there are breeding sites. This is interesting because it indicates that there is something going on, education, norms, or otherwise, that is breaking the line of transmission in these areas. But, you could say, maybe what we see in the breeding overlay is actually a representation of all the areas where aedes aegypti mosquito breeds and not all mosquitos have the virus responsible. In which case, the next map to look at would be the overlay of the areas receptive to malaria

In the above map, the “natural” habitat suitable for the malaria vector (anopheles gambiae) serves as a proxy for “natural” habitat suitable for aedes egypti. This overlay shows that a large portion of the mosquito breeding sites are, in fact, outside of the malaria receptive areas. While this map can party be explained by a lack of sampling depth for breeding grounds in the receptive areas, the fact remains that areas that were not expected to be breeding grounds simply are. Life in the Anthropocene for the mosquito is booming.

Taking a step back and looking at the dengue clusters in relationship to the hotels, we can get a sense of the places that tourists are likely to be. This can serve as a proxy for areas that might be thought of as desirable. It surprised me to see that while there are some clusters close to hotel locations, the hotels seem to carefully avoid them. I was then interested to delve into looking at how sharp the economic divide might be at those borders. While I wasn’t able to find data that was easily transferable into the format of this map, below are two maps that can give some insight. The first is of the train-system throughout Singapore and the second is a property heat-map. I chose to look into the train system to see if there was a relationship between transport hubs and dengue clusters in terms of 1) disease mobility and 2) if economic centres (well-serviced by transit as a proxy) faced the same intensity of disease compared to less economically active areas. While perhaps useful, these might be questions that are beyond the scope of this assignment. The property heat-map can give some more understanding of where the affluent and economically disadvantaged live.

Bajaj, Abhishek. (2015). Exploring Urban Poverty in Singapore A lens on the influences acting on a child growing up in a lower socioeconomic environment. 10.13140/RG.2.1.4880.7767.

Death by Compounding

Jason and I collaborated on this and he’ll be writing up our final blog post; in the meantime click the image above to go to an interactive visualization of pharmaceutical compounding errors in the US!