Validate a Social Media Movement

Rochelle Sharpe, Adrienne Debigare, and David Larochelle

       It didn’t take long for conspiracy theories about the Boston marathon bombers to take hold on social media.

       On the same day Dzhokhar Tsarnaev was captured in Watertown, Ma, the Twitter feed “FreeJahar got created – and it’s been growing ever since.

       “Look at his hair,” someone tweeted earlier today. “Would a terrorist have nice hair?”

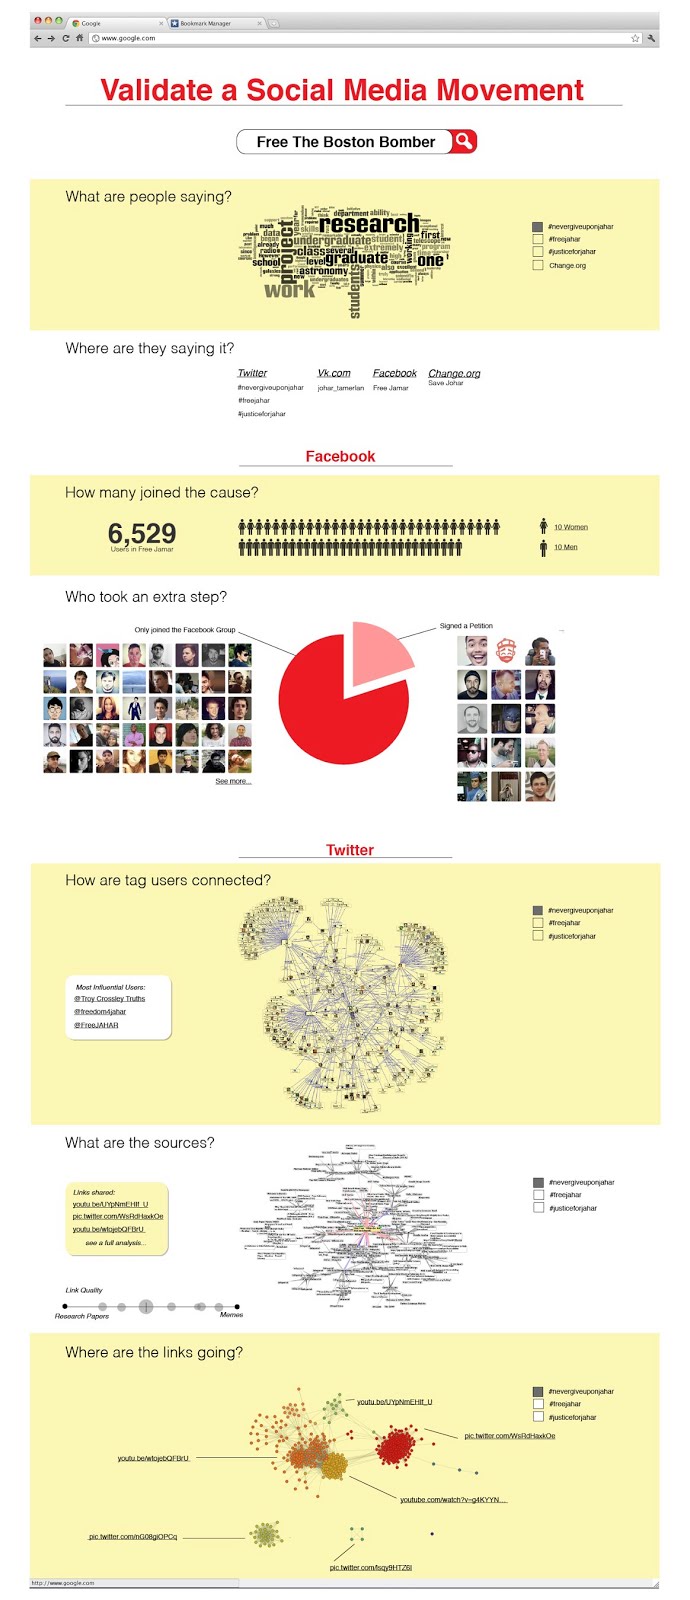
       While hundreds of Twitter followers and more than 6,000 fans of a Facebook page asking whether Jahar has been set up, a bigger question emerges about social media. How can the public possibly know whether the conspiracy theorists are a growing movement or merely a tiny band of people who’ve figured out how to hijack social media to amplify its message?

      Certainly, the Jahar conspiracy theorists now have the nation’s attention, with large newspapers, like the New York Post, picking up the story. “Smitten teen girls stir up #FreeJahar mania for Boston marathon bombing suspect,” the Post’s headline blared last Sunday.

      We propose a tool to assess the legitimacy of opinions spread on social media. It would essentially apply the age-old basic journalism questions, the who, what, when, where, why, to assess the validity of social media posts.

      How many supporters are needed before a movement is significant? The White House has struggled with this question with their We the People petitions. They initially required 5,000 signatures within 30 days to get a response. After being inundated with more petitions than they could handle, they raised the number to 25,000 and then to 100,000.

      When covering an emerging social movement online, it is important to know who actually supports it. We developed a prototype tool to analyze the membership of the main Jamar Facebook group. Although the New York Post portrayed supporters as smitten teenage girls, we found that the Facebook group was overwhelmingly male. We also found that the overwhelming majority of members were likely to be US based. (The facebook group went invite only before we could perform additional analysis.)

      Encouraged by the success of our prototype, we propose the creation of a more powerful suite of tools for analyzing social media movements. These tools would allow journalists to quickly analyze a social movement quantitatively rather than just qualitatively.

      The proposed tool suite would be able to show the following:

  • Word clouds based on the contents of tweets containing a hashtag or posts in a facebook group.

  • What social media services the conversation was taking place on.

  • How many users took the extra step of signing an online petition.

  • How users of a twitter hashtag are connected

  • What types of sources are being cited — research papers, mainstream media articles, blogs, memes, etc.

  • Where do links in the conversation go?


Proposed Final Project: Analysis of the Boston Marathon Bombing

By Rochelle Sharpe, Adrienne Debigare, and David Larochelle

With the investigation into the Boston marathon bombings now an international inquiry, we want to explore how different countries are covering this continuing story.
We want to compare how the U.S. and Russian media are covering the investigation, examining newspaper and blog posts on the FBI’s handling of Russian intelligence about Tamerlan Tsarnaev. We will use Media Cloud as a base to explore coverage, perhaps designing user friendly graphics to make Media Cloud information more user friendly.

Alternatively, we may look at ways to use machine learning to help analyze bombing coverage. For instance, we might be able to use machine learning to group articles by topics or look at patterns of tweets.

One major problem is that Media Cloud’s Russian coverage is in Russian. So, we have found a student to help us do some translation.

Posted in All

Kenyan Subsidized Fertilizer Explained

Earlier this month, both the Standard  and NTV reported that farmers in Kenya were having difficulty buying subsidized fertilizer.

In Kenya, fertilizer is available to small farmers from the government at subsidized prices. For example, 50kg of Diammonium Phosphate (DAP) is available at Sh2,500 ( around $25US ) subsidized. If purchased from private traders, it would cost between Sh3,500 ( $35US) and Sh3,700 ($37US). However, these subsidies are only available if the fertilizer is purchased from the National Cereals and Produce Board(NCPB) a Kenyan government run company. The fertilizer was only available at certain NCPB locations forcing farmers to travel significant distances and stand in long lines. Kenya’s government only allows small farmers to purchase subsidized fertilizer and the lines were likely exacerbated by the need to produce paperwork.

The traditional arguments for fertilizer subsidies in Africa are that fertilizer use there lags behind other regions such as Latin America and South Asia. The reasons cited are lack of knowledge of fertilizer use, farmer’s lack of capital to buy fertilizer, and farmer’s unwillingness to take risks. Furthermore fertilizer has positive externalities such as reduced soil erosion from increased plant growth.*

In most of Africa, fertilizer subsidies began in the 1960s and 1970s. These programs were typically implemented through government owned corporations that were given a monopoly on fertilizer and sold it at below market prices. Aid agencies and Western governments were often critical of the practice and in the 1980’s they began pressuring African governments. They maintained that fertilizer subsidy programs were inefficient and discouraged private sector businesses. The real problem facing African countries, they argued, was inefficient resource allocation. During this period many African countries got rid of their fertilizer subsidies due to Western pressure.*

However, more recent thinking on food subsidies has changed. Malawi, after following international recommendations to eliminate fertilizer subsidies, faced widespread food shortages in 2005 after a disastrous harvest. Determined not to repeat this, its government began instituting fertilizer subsidies and has enjoyed record harvests.*  Pointing to Malawi’s success, some Western economists such as Jeffrey Sachs now advocate fertilizer subsidies in Africa. In a notable difference from the Kenyan approach, the Malawi government issues farmers coupons that can be used to purchase fertilizer from private merchants at the subsidized prices rather than selling the fertilizer directly. However, Malawi’s policy is expensive — running as high as 16% of GDP in 2008.

Even these Western countries that have pushed Africa to embrace laissez-faire economics and eliminate fertilizer subsidies, extensively subsidize their own agriculture. So, African government that subsidize fertilizer are following the policies that the West practices rather than what it preaches.

Boston Restaurants: Perception vs. Reality

By Rochelle Sharpe and David Larochelle

Yely’s Coffee Shop in Jamaica Plain gets rave reviews for its authentic Dominican food.

“Best Latin take-out food in the area,” one Yelp writer gushed, urging people to “come here if you want yummy pork or juicy rotisserie chicken.” Others described the meals as “incredibly delicious” and high-quality,” with one fan declaring: “I will go far, far out of my way for a plate of Yely’s rice with chicharones. . . Nowhere else measures up.”

But for Boston’s health inspectors, the restaurant has a more dubious distinction. Yely’s has had its business permit suspended more often for food safety violations than any other restaurant in the city during the past six years, with inspectors complaining of food preparers not washing their hands after coughing into them and dead mice decaying in traps on the kitchen floor.

Yely’s lost its license five times since 2007, edging out My Thai Café Vegetarian & Bubble Tea Bistro in Chinatown, which had its license suspended four times and Navarette Restaurant, a barbeque place in Dorcester, which lost its license three times. None of the other 254 restaurants that had their licenses temporarily suspended in Boston were shut down more than twice, according to city health inspection records.

Year after year, health inspectors found similar problems at Yely’s. In 2008, the first time the restaurant lost its license, inspectors complained about substandard equipment and widespread sanitation problems. “No hot water throughout,” the 2008 report said. “Owner is working on hand sink in basement.”

Workers were using wooden sticks to stir food, inspectors said, and thermometers to detect improper food temperatures were broken or missing. Standing water covered the floor, where there were broken tiles and sheets of cardboard being used as mats. “Food handler cough into hands and not wash hands or change gloves,” one inspector wrote, urging the restaurant owner to get safety training for all employees.

But the 2012 report found similar issues. Inspectors found shelves in the food cooler covered in rust and grime. “Observed employee serve food, handle money, answer phone, without stopping to wash hands,” the report said. As for mice problems, it said: “remove dead mice observed attached to four different traps in storage room in basement. . .Rodent droppings observed on floor of storage room in basement, on floor of walk-in cooler, on floor around hand sink . . .on counter tops, shelves, and various other locations.”

At My Thai Café and Navarette Restaurant, meanwhile, inspectors found a variety of sanitation and cooking problems. The city cited the Thai restaurant for improper refrigeration, leaving soiled dishes in sink overnight, and workers smoking and leaving cigarette ashes in the kitchen sink. At Navarette, they discovered pork and beef that were only half way cooked and dangers of food cross contamination because workers were storing raw fish and pork above cut ham and cheese.

Overall, restaurants in Chinatown were shut down most often, with 14 restaurants in the tiny section of town having their licenses suspended during the past six years.

Interview with Cynthia Guanghan Liang

Cynthia Guanghan Liang, 38,  is a professor at Sun Yat-Sen University in  Guangzhou, Guangdong China. She completed her PhD in Management and Mass Communications at Zhongshan University. She is currently a visiting researcher at the MIT Center for Civic Media where she is studying the differences between civic media in the United States and China. According to Liang, the most salient difference is that civic media in the US is almost exclusively online while civic media in China also appears in print.  She speculated that this difference arises both because people in China are more likely to trust information in print and because many in Chinese have less access to the Internet than those in the US.

Liang related that Chinese civic media is used extensively by nonprofit organizations (NPOs) and nongovernmental organizations (NGOs). NPOs and NGOs use civic media to promote events, recruits volunteers and solicit donations. Liang said ““Most NPOs are very grassroots. Some NPOs only have 3 or 4 people. [But] they can do many things to help people in places where the economy is not very good.” Among the noteworthy successes, was the campaign on weibo, the Chinese equivalent of twitter, to raise money to provide lunches for school children. The campaign raised significant funds and more notably attracted enough popular support that the Chinese central government began funding a school lunch program.

David’s Media Diet

The following are stats derived from using RescueTime.

After tracking my media habits for the past week, what I found most striking is not the media that I consumed by what I didn’t consume. This is most striking in terms of format – almost no media was in formats that existed before the web. The one exception, was NPR which I listened to for 10 minutes on a car radio. The books, I read were in PDF format rather than paper. The videos I watched were seen online rather than on a television. If meetings and lectures count as Media they were the one traditional format that took up significant time.

I was surprised how little time was spent on news. I expected Google News to rank higher than it did. I now realize that I would simply glance at Google News a few times a day, never spending more than a few minutes there.

In terms of the Media where I do spend time, Gmail was by far the site I used the most, This was to be expected since I use gmail as a task manager through the ActiveInbox browser add-on. Thus the time spent on gmail includes task management activities in addition to traditional email.

In terms of applications, the gnome-terminal (Linux command shell) was where I spent the most time. During the past week, I spent considerable time accessing remote machines through ssh.

Shopping sites such as amazon.com and slickdeals.net also ranked highly. In the past, deal sites such as Slickdeals.net have been a time consuming and expensive addiction for me. Perhaps, because of my backgrounds in economics and security getting great bargain is immensely satisfying — even if it’s for something I don’t really need. Thus I’m relieved to have spent less than 2 hours shopping there.


Chart of sites:

Chart of Sites
Chart of categories