An Online Social Platform for Engaging with Boycotts

Here’s the link to the site. You can click around to explore the different petitions and even create an account, but so far you can’t actually submit any forms or like or sign anything.

http://wecott.csail.mit.edu/

wecott1

WeCott is a (prototype) website built by myself and three friends during the iCorruption hackathon a few weeks ago. We envisioned a platform of communities where people could participate in boycotts together – offering advice on alternatives, uploading photos of their boycott, and otherwise supporting each other. Not only would this make the process more fun and supportive, it also allows people and companies to see the effects of the boycott all in one place. You can see some more of our thoughts and designs in our presentation pitch.

These last two weeks, myself, Giovana, Alicia, and Wahyu have been brainstorming how to use this platform to talk about issues that we cared about. The first thing that we realized was that while boycotts could be very powerful as a general tool, it’s not often clear exactly what to boycott given a particular issue. Sometimes problems are so systemic (such as Ferguson) or involve things that we are unable to give up (such as our government). These types of problems may involve some more creative thinking about what could be done as an individual. Other problems fit well into the boycott mold. However, we acknowledged that often boycotts hurt people lower down the power ladder such as workers instead of the business leaders we want to target. At the end of the day, that is a tradeoff that we must make as individuals when voting with our money. Sometimes, whether we know it or not, we can be perpetuating or contributing to entities and problems that we do not support, just when we go to the grocery store!

Giovana and Wahyu both contributed a petition to WeCott – here and here. They can speak more about the specific issues they investigated and the thought processes they went through to create the petition.

wecott2

I can talk a bit about the design of WeCott and also what else I envisioned but didn’t get to prototype. As you can see, there is a dollar amount that is associated with each petition that is supposed to collect all the money that people have pledged that they will divert. A bit about this – I felt that having a dollar amount would be a really powerful signal to companies. And while we can’t guarantee that people will stick to that, we have thought about ways to help people that pledge, such as sending notification emails, and to encourage people to be accountable, such as uploading photos or maybe checking in on a map to then gain points or badges. I can see other features such as news updates, goal setting, discussion boards, and local or map integrations that could help keep momentum going and provide local support. A lot of the initial design inspiration for WeCott came from both Change.org and Kickstarter. One member of the original team will be presenting WeCott again at the bigger iCorruption conference some time next week.


Posted in All

More plants, less meat

For this assignment I wanted to try something really simple. The “do something” component of a lot of stories about the harm caused by the meat industry is fairly straightforward — asking people to eat less or no meat. This is of course a more tractable problem in theory than, say, how an average reader would go about “doing something” about Boko Haram. But just because people can theoretically modify their diets doesn’t make such changes all that likely.

My premise was what motivates one person to change their diet is different than someone else, so showing pictures of overcrowded hen houses to someone who is mostly concerned about reducing their saturated fat intake might make the “you can make changes that have real impact” message sound preachy. So I hid each (brief — could use development) reason for changing diet under a sub head. I can’t really tell how well it works as a concept so feedback is appreciated.

In retrospect I think this piece could have benefitted from more focus on the “how” of changing your diet as opposed to the “why,” and perhaps with more “further reading.”

http://austinhess.github.io/lessmeat/

Posted in All

From Reading to Social Online Forum

For this assignment, I was thinking more on how a natural scheme could emerge from reading a newspaper article. For example, the recent news article on South Africa xenophobic killing incident would surely generate lots of discussion. However, how can we leverage on the urge that readers would naturally respond to provocative news contents? Therefore, I aim to focus on a mechanism and a tool that could help generate such responses.

A potential theory for readers to gain traction with regard to a particular story is decentralized discussion versus viral phenomenon. While viral propagation is goes virtually with fewer deep discussions around the topic, meaningful discussions are nevertheless key to initiating grassroots movements. Therefore, my scheme would involve decentralized movement where people would start their own social media campaign trying to involve their immediately connected community members to discuss. If the contacted members find the issues interesting, they may likewise pass on the conversation. The aim of this social campaign is not mainly to optimize total number of people involved, rather, it tries to optimize total of actively engaged online users who may transform into further engagements revolving a possible resolution of the issue.

The following link shows a crude outline of what may possibly be a solution. First, a quick walkthrough of the website:

0. One needs to login to Twitter (or other social media accounts) and verify with app credentials

1. One first chooses a news article of interest

2. She should search relevant terms on Twitter for key phrases of discussion

3. She then starts a timed social campaign where she initiates the discussion through retweeting a popular yet provocative tweet or posting one of her own trying to contextualize through some hashtags. Within the timeframe allotted, she should generate certain volume of discussion with the amount of audience that meets the minimum level of public attention (say for example, 10 followers with average of 500 followers for each user -> 5000 potential viewership on the topic).

Steps 0-3 can be iterated for different individuals. At the end, we can aggregate similar discussions into larger discussions, naturally leading to virality. This is essentially a bottom-up approach to decentralized civic journalism. The website tries to reflect the above line of thought.

* site only tested on Chrome with 2650×1600 sizing (unfortunately not dynamic layout), so viewing experience may be affected.

http://web.media.mit.edu/~pernghwa/news_reaction.html

Posted in All

You Are Not Alone: Sexual Assault at MIT

In response to this New York Times article which is in turn in response to this climate survey by MIT, I’ve made an infographic on how one might go about speaking up and reporting their own experiences– the first step to tackling a deeply traumatizing and complicated issue. One of the most terrible aspects of being sexually harassed is the feeling of both being utterly alone and having to retell one’s story over and over again. Facts and figures from this survey proves that one is, unfortunately, rarely alone and that there are resources to report anonymously to– hopefully fueling greater cultural and civic change to our treatment of these problems.

https://infogr.am/you_are_not_alone_speaking_up_about_sexual_assault_at_mit


Posted in All

French Patriot Act

surveillance

A few days ago, France adopted a new set of law called “Loi sur le Renseignement (“Information Gathering Act”). Despite being a very controversial law that grant extensive power to the Prime Minister and his office to run any mass and personal surveillance they want, it was not really publicly debated and little is known to the public on what they could have done to express their opinion and what they could do know to protect their privacy.

I decided to list a few resources that could have been useful to be advertised by medias before the vote and actions that people can take now that the law is in place. If there was tools to automatically surface those actions from articles and put them in front of the user, raising the action threshold may be possible. (sorry, most of the content is in French…)

It started with a first law allowing censorship on the web without the accord of a judge. Many so-call Islamic websites have been blocked and some people may have seen in France this image explaining that the website they were trying to view was blocked.

mainrouge

Action: read more on websites blocked and read testimonies of people running those websites who explain that they were not promoting terrorism at all.

Following this wave of censorship, many organizations in defense of civil liberties tried to raise the alarms.

Action: watch video explaining the content of the new bill and its potential pitfalls.

stop

When the bill seemed to get traction, a campaign of information tried to raise awareness and engage people into submitting their opinion to their local representatives.

Action: go on the website Sous Surveillance to read about the full project of law, get local representative phone number of Twitter username.

assemblee-nationale

When a project is introduced at the French parliament, they is a way for people to share their opinion and give feedback on a the bill.

Action: read the impact analysis of the bill and share feedback to deputies. For lazy people, a tweet to a members of the government could have been a first step.

manif

On the day of the vote, Monday April 13th, a public manifestation has been organized by many civil liberties organizations.

Action: take part in the manifestation.

bigbrother

After the bill was still voted into law, knowing the content and what people can do to protect themselves is the only thing left to do.

Action: watch the French Interior Minister announce that privacy is not a civil liberty, read about the vote done by only 30 deputies out of 577 or the IMSI catchers in front of Parliament during the manifestation, learn about VPN and SSL to protect privacy.


Posted in All

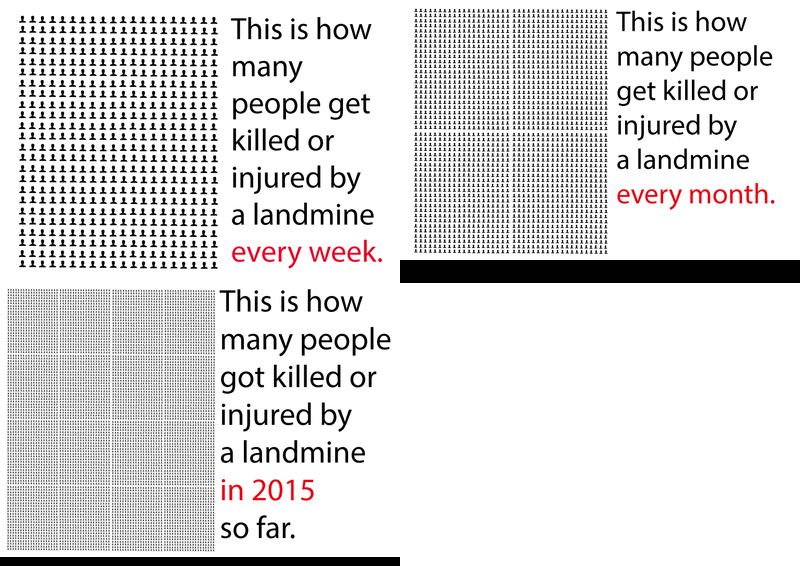
Landmines kill and injure daily

http://picasion.com/

What are landmines?

Antipersonnel landmines are explosive devices designed to be detonated by the presence, proximity or contact of a person. Landmines can remain dangerous many years after a conflict has ended. They indiscriminately kill or injure civilians, aid workers, peacekeepers and soldiers alike. They pose a threat to the safety of civilians during conflicts and long afterwards. Landmines still daily kill or injure thousands of people every year in some 60 countries around the world.

What is the Ottawa Treaty?

A global movement to prohibit the use of landmines led to the 1997 Convention on the Prohibition of the Use, Stockpiling, Production and Transfer of Anti-Personnel Mines and on their Destruction (or simply the Mine Ban Treaty or Ottawa Treaty). Currently, a total of 162 nations are party to the Ottawa treaty.

Which nations have not signed the Ottawa Treaty?

To date, there are 162 states parties to the treaty. One state has signed but not ratified (The Marshall Islands) while 34 UN states including the United States, Russia and China are non-signatories, making a total of 35 United Nations states not party.

What remains to be done?

The International Campaign to Ban Landmines (ICBL) calls on states to destroy their stockpiles of antipersonnel landmines, and report on progress of stockpile destruction, in addition to reporting on planned and actual use of retained mines. Mines need to be cleared and victims need assistance. The ICBL supports individuals who want to hold a landmines conference, lobby decision-makers or organize a public event on landmines.

Sources: New Internationalist, ICBL

Disclaimer: My goal with this assignment on advocacy journalism was to figure out how to demonstrate and visualize the ongoing fatal issues with landmines and to let individuals know what they could do about it. The source I relied on for my animated gif claims that every 20 minutes someone gets killed or injured by a landmine, which is equal to about 500 a week. After creating the animated gif based on these numbers, I found other sources specifying lower numbers. In advocacy journalism, it seems important to avoid becoming the PR department of an NGO, especially if you think what they do is relevant. After finding conflicting numbers, I would—in real life—go back and change the animated gif and use the lower numbers from a seemingly more reliable source. It would still be shocking enough.

Posted in All

Readers, Take Action (By Melissa Clark & Gideon Gil)

Buy Local Save Global is the companion piece that Gideon Gil and Melissa Clark created in the hopes of offering readers potential actions to take after being subjected to a specific piece of information media.

In this case, the previous information comes in the form of a video that reports on the recent water shortages in California, conveying the struggle amongst farmers and residents in the state.  Our research and display of information was designed to be as unbiased and as educative as possible.  To accomplish this, we decided to implement a poll (to engage the reader) and then to supply them with easily accessible information (in case they wanted to do something about what they just saw and read).  We strongly believe that the combination of the poll, followed by immediate action steps, will help alleviate readers’ feelings of helplessness concerning a seemingly distant problem.

Below is the link to your site, enjoy!

Buy Local Save Global

Posted in All

Trends in Cosmetic Surgery … as measured in Units of Real Housewives (Data Visualization Assignment)

In research for an NPR series on women and image last year I came across data from the American Society of Plastic Surgeons that charts changes in cosmetic surgery procedures since 2000 – both surgical and “minimally-invasive” — generally fillers like Botox.

In 2013 Americans spent $12.6 billion on such procedures, almost all elective.  (The ASPS keeps separate data for medically-necessary procedures including reconstruction after cancer or injury.)

As you can imagine, this is pretty rich fodder.  There are numerous ways to compare or slice the data – some of which the ASPS does itself (by region, gender, age etc).  Below are some surprising discoveries, two of which we attempted to represent.

– Some procedures have seen dramatic changes in 13 years.

For example: there has been a 4,565% increase in “Upper Arm Lift Surgery” – a category or procedure that practically didn’t exist in 2000.

“Lower Body Lifts” are up 3,417% – a procedure the ASPS clarifies as “improv(ing) the shape and tone of the underlying tissue that supports fat and skin.” Basically, get rid of your sagging butt, your flabby belly, your dimpled thighs – all in one go!  Amazing, right?  If you like that kind of thing and are willing to spend some time in recovery.

– In the non-invasive sphere, “injectables” like Botox, and “soft-fillers” like Restylene show triple-digit increases.   These new substances have largely appeared since 2000, and are increasingly advertised in women’s publications and in the waiting rooms of dermatologists’ offices.   This stuff has become, in some cities, the “new normal” for women in certain industries, age groups or in the public eye.

There’s some good reporting to be done about how these chemicals have been created or repurposed, approved and brought to market as material that can be injected, absorbed and broken down by the body.

– There are also declines – nose jobs and liposuction are down.

I encourage anyone curious to simply look over the data, with a critical eye – as some things show dramatic growth by virtue of being new; and others –  like nose jobs, eye lifts and breast augmentation – still accounting for the lion’s share of these elective surgeries.

I simply wanted to show some of these dramatic changes.  I could say this is “value-neutral” but obviously, I have some thoughts here about how we are reshaping the norms of female appearance (the vast majority of the procedures are done by women).   Thanks to classmate Celeste LeCompte, I wandered my way into exporting data to Excel and making charts, and then to Photoshop, to illustrate them.

We originally tried to render some of these comparisons in Excel charts but they were both visually boring and confusing when we tried to compare rates of growth in procedures.

So, we settled on some icons who’ve helped introduce America to the Brave New World of Surgical Enhancement:  the Real Housewives.

Below are two procedures:  the lower body lift, as represented by Real Housewives of New Jersey’s Jacqueline Laurita jacqueline-laurita-rhonj-reunion-finale

And the nose job as visualized here by Atlanta’s own Real Housewife Kim Zolciak.   article-2130709-12A07CED000005DC-489_306x423-2

Several caveats apply:   Data is available in 2000, not from 2001-2004, and picks up again in 2005-2013.  It’s self-reported, by the ASPS, not by any government agency (which classmate Gideon Gil says is not required).  The Photoshopped images are – to scale, sort of.  And probably a hundred other things that make this scientifically squishy.

Let’s start with what’s NOT happening as often:  nose jobs.

Noses

“Nose reshaping surgery” has fallen off from 389,155 performed in 2000 to only 221,053 in 2013 – a drop of 43% — or, only about half the Kim Zolciaks as once took place.  (The Reality Star has denied having rhinoplasty – as recently as last week).

Since there a few years of missing data, it’s hard to pinpoint when the decline started.  As to the why? That’s entirely speculative.  People happier with the noses God gave them? Who nose?

Let’s turn, instead, to a growth industry: the Lower Body Lift.

LowerBodyLift

As you can (sort of) see, in 2000, it was almost non-existent – some 207 procedures.

By 2013, 7,281 people had this done in a year.  Interesting to note a drop from 2006 to 2007, a bump in 2010, then drops.   RHONJ Ms. Laurita has publicly discussed her several procedures, so we’re not casting aspersions by using her image.

There is so much value-laden here, and so many, many possible interpretations.  Among our questions:  did the economic meltdown of 2008 have an impact (it seemed to in some instances) given that these are essentially discretionary purchases? Could any tool show a predictive association? Is there a way to cross-reference around a marketing push by the pharmaceutical industry?  Will Joan Rivers’ death at a medical day surgery center have an impact on the safety of this kind of thing?

I’ve treated this as a light-hearted exercise simply to get practice in working with new tools (Thanks, Celeste!) like basic manipulation of tables, and Photoshopping.  But there are myriad possibilities for some serious news gathering here and some even more serious discussion of what we make normative.   Women have been enhancing their appearances at least since Cleopatra; so who am I to judge whether using surgery or fillers is somehow less acceptable than, say, wearing lipstick?  But I am left uneasy, seeing this data, and hope it’s something we as a society can consider.


Posted in All

Moral Values and the Discussion on Abortion on Social Media

One of my main interests is in analyzing user-generated data, whether that be comments, tweets, or check-ins. I have a side research project that I am working on related to abortion and public policy and so decided to use this homework assignment as a way to get myself started on analyzing the data from this project.

I did most of the work in python, using the awesome libraries of tweepy (Twitter API wrapper), matplotlib (plotting), pymongo (interface to mongo database), and nltk (natural language toolkit). I used a mongo database to store the data but it wasn’t super necessary (plain text files can easily suffice). I forgot to take into account how long it would take for the scripts to crunch through all the data, so when I got started last night, I quickly realized I’d better let the scripts run overnight and write up a post this morning.

My dataset consisted of 663131 tweets related to abortion collected from the year 2013. To find tweets related to abortion, I looked for key terms such as “abortion”, “abort” + “baby”, “abort” + “birth”, “prolife”, “prochoice”, and some others, including common hashtags.

Here is some basic info on the tweets I collected:

Total Volume of Tweets over time (x=month of 2013, y=number of tweets): figure_1

You can see that the volume varies quite a bit. Looking at the top words used each month, removing stopwords (very common English words), we see the following (I show the word as well as the number of times that word appeared in tweets in that month):

Jan ‘prolife’, 5783 ‘women’, 2894 ‘life’, 2540 ‘roe’, 2460 ‘baby’, 2276
Feb ‘prolife’, 3300 ‘women’, 1965 ‘baby’, 1606 ‘bill’, 1334 ‘prochoice’, 1307
Mar ‘prolife’, 3026 ‘dakota’, 2528 ‘north’, 2441 ‘ban’, 2030 ‘baby’, 1926
Apr ‘gosnell’, 14940 ‘prolife’, 6591 ‘clinic’, 5682 ‘trial’, 4586 ‘baby’, 4081
May ‘gosnell’, 6672 ‘prolife’, 5483 ‘murder’, 3401 ‘doctor’, 3301 ‘baby’, 3156
Jun ‘texas’, 12705 ‘bill’, 11218 ‘women’, 6538 ‘prolife’, 6530 ‘filibuster’, 4771
Jul ‘texas’, 14946 ‘bill’, 11675 ‘prolife’, 8196 ‘women’, 7289 ‘law’, 5142
Aug ‘prolife’, 4958 ‘women’, 3112 ‘tcot’, 2493 ‘prochoice’, 2343 ‘like’, 1822
Sep ‘prolife’, 3572 ‘pope’, 2950 ‘baby’, 2577 ‘women’, 2238 ‘church’, 1884
Oct ‘prolife’, 3905 ‘texas’, 3393 ‘baby’, 2562 ‘judge’, 2550 ‘law’, 2272
Nov ‘weeks’, 5254 ‘texas’, 4721 ‘baby’, 4634 ‘prolife’, 4285 ‘women’, 3596
Dec ‘praytoendabortion’, 28535 ‘prolife’, 5228 ‘life’, 5082 ‘women’, 4954 ‘baby’, 4083

We can clearly see that some volume seems to be driven by news events, such as Senator Wendy Davis’s filibuster in June to block a restrictive abortion bill in Texas. Other drivers perhaps include Twitter campaigns (#praytoendabortion). This also is a good point at which to audit one’s data and zoom into weird findings to check if the data is properly cleaned. I didn’t have time to do that here, but if I did, I would look at the tweets behind some of the weirder top 5’s that I didn’t understand and either learn something new about abortion or find ways to remove the invalid tweets from the dataset.

The last thing I did was to analyze the language in the tweets for moral values. This is part of a larger research project I am working on related to modeling ideology and linking that to policy change. You can see a complete version of this work here when I looked at same-sex marriage. Another important step which I am skipping is validation, or trying to correlate numbers crunched from the data to traditionally collected data, such as census or poll numbers.

To analyze moral values, I am using a supplemental LIWC dictionary built by political psychologists and linguists that attempts to match key words with underlying moral values. The 5 moral values we use are taken from research on moral foundations by political scientist Jonathan Haidt and some other people. They’re an attempt to understand the underlying values that people find important. Do you care more about fairness or more about loyalty and authority? Not surprisingly, these moral foundations somewhat correlate with either liberal or conservative ideologies.

So, given the keywords ascribed to each moral foundation, I counted the relative occurrence of each moral foundation within every tweet and then averaged that relative occurrence across all tweets within a month. The following is the outcome:

Moral Values Over Time (x=month in 2013, y=average relative occurrence in tweets)

figure_1


Though we see more authority and harm language than the other 3, this doesn’t necessarily mean that people think more about some values relative to other values because our method can’t be comprehensive. But we can look at a single value over time. For instance, it’s pretty notable how purity language jumps up in October. I didn’t have time to dig into why but that would be my next step.

Future work that I intend to do would be to look at these traits broken up by state. You can do that by analyzing the location field that people specify in their profile and trying to match that to a state. I would want to look at several of the other LIWC categories and also come up with some more features of my own. Finally, it would be interesting to look at features over time – leading up to and after key events, for instance.

Posted in All