William’s Media Diary


This was an interesting and challenging assignment. Defining what to include as media consumption, figuring out how to measure it, and summarizing the mass of data in a reasonable form were some of the design decisions I had to make. I decided to provide qualitative observations on my offline and mobile access and then try to “deep dive” into my web history to gain further insights into what I consume.


Offline Media


  1. Print: I don’t currently subscribe to any newspapers or magazines. I picked up and skimmed the MIT student newspaper (the Tech) and the newsletter of the graduate dorm I live in (Sidney Pacific). The elevators of Sidney Pacific have a wide array of posters that I inevitably see every day. A common characteristic of the print media I consume is that they are simply there.

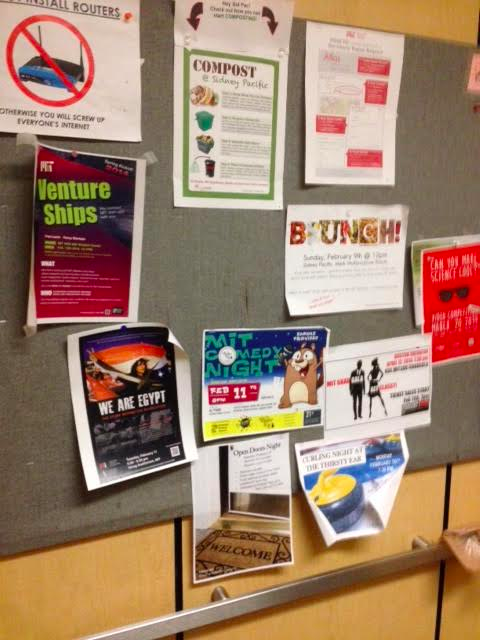
Elevator posters on February 8.

  1. Television: I watched the Olympic opening ceremonies on Friday, February 7 for two to three hours. I also turned on the television at a few points this week, out of habit. Usually, I channel surf or leave the television on as background noise. Possibly because of the way that television is architected — it’s really easy to press the channel-up or channel-down button — I probably get a wider variety and range of perspectives than I do when I’m on the Internet. For example, this week, I’ve watched at least of a few minutes of PBS, the three major American networks, the Discovery Channel, Fox News, and C-SPAN.


  1. Radio/Music: I didn’t listen to the radio this week. I usually listen to NPR if I drive, but I didn’t drive this week. I used Songza (a website like Pandora that gives personalized music recommendations) to listen to music on my phone and computer.


Mobile

A substantial amount of my media consumption is on my phone. Unfortunately, I didn’t find a good tool to automatically track my mobile usage or automatically take screenshots; in hindsight, capturing my browsing history might have worked to some extent, but it wouldn’t have been able to capture all of my usage through various apps. It’s my hope that my deep dive into my desktop Internet usage will capture some of these patterns.


A key exception is Facebook. A few weeks ago, to reduce distractions on my computer, I decided to logout of Facebook from my computer and access it only on my phone. I think that it has been a successful experiment — I’ve only logged in to Facebook on a couple of occasions. On my phone, I accessed Facebook on a daily basis and generally click on a few links on my news feed.


Desktop/Internet

RescueTime

As a first step, I used RescueTime to measure my computer activity. As illustrated below, it provided an indication of when I’m on the computer and the types of activities I do. It seems like a lot of my most productive hours are in the early evenings and early hours of the morning.

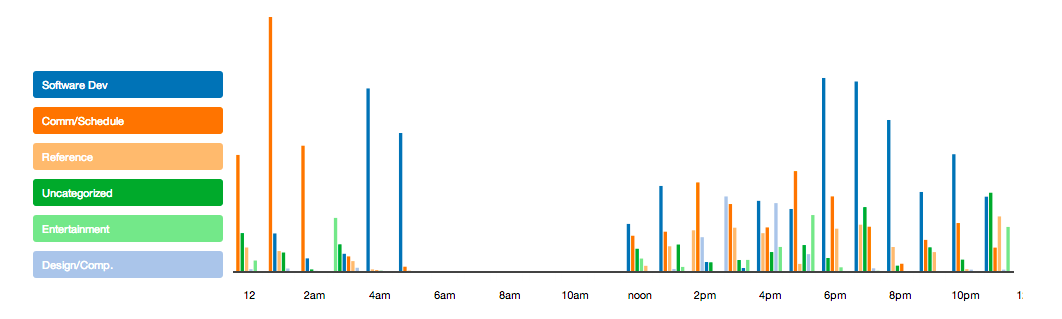
Usage by hour of day
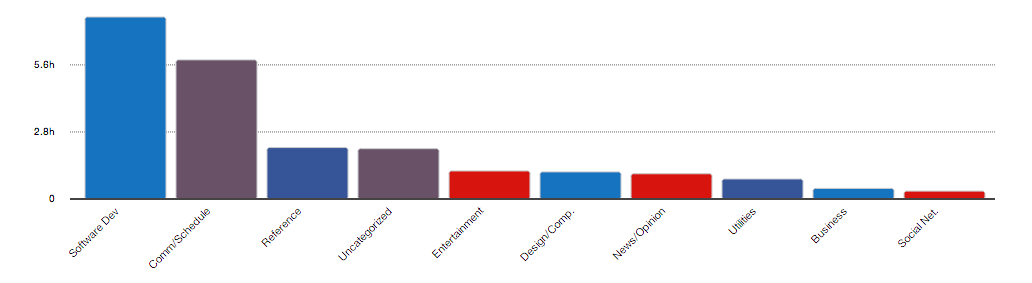
Usage by category


RescueTime also provided a breakdown of my news and entertainment consumption:
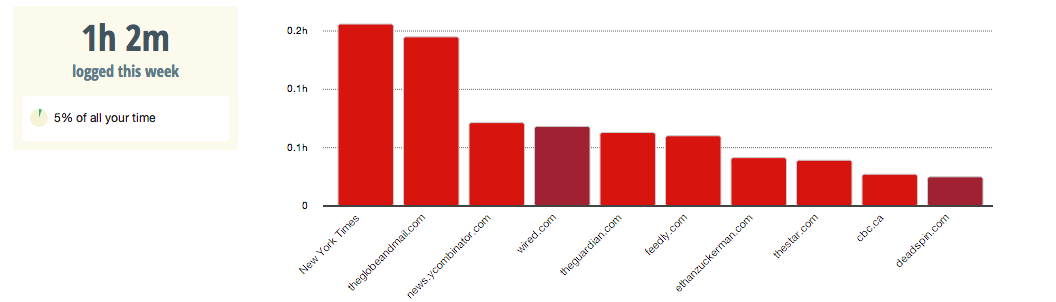
News consumption

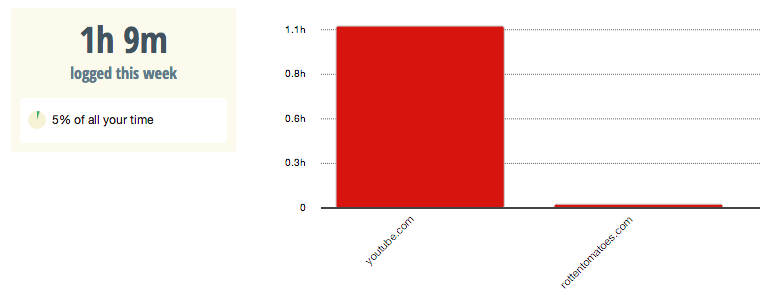
Entertainment consumption

Reflections


  1. I’m pretty surprised by how much I read Canadian media — I usually go to these URLs as a distraction.

  2. In contrast, I “stumble upon” other kinds of physical offline media more often.

  3. It’s interesting to think about how to think about and capture offline interactions and media consumption. The ways that I can think of, such as written or audio journaling or taking photos regularly, seem fairly disruptive and invasive.

  4. It takes time and effort to trace one’s own media consumption. Notably, large Internet companies — Google, Facebook, Amazon, Twitter, and others — have substantial infrastructure and resources capturing every click and action of their users. It is interesting to think about what insights can be gleaned from that data, along with the limitations of what they can infer about human behavior and preferences.

Dalia’s Media Diary

For my data collection, I decided to use the application Rescue Time. Rescue Time is ideally used to enhance productivity and manage the amount of time spent on ‘disruptive’ sites. The user can indicate a set of productivity goals with a set of sites that would be considered disruptive and calculate productivity on a daily basis based on media consumption.

 I, on the other hand decided not to set any goals and just record my consumption based on sites visited. I do have to note that I have reservations regarding the pre-defined categories in the application, especially when Twitter and Facebook are considered disruptive sites. I find this problematic, not only because I use both platforms to conduct research, but also because I find that both sites can be valuable sources of information and news. Let alone the fact that other forms of media, such as daily interactions and talks are obviously not recorded and thus not represented in this data set. My other reservation is the fact that I can pause the application and stop recording any media I consume. I have to admit I used it on multiple occasions, which gives a skewed result of how many hours I was online and the media I consumed. Regardless, I found quite interesting results and patterns in the data set which I present below.

When I first thought of doing this assignment, I thought of creating a time lapse video of the sites I consumed using the data I collected from Rescue Time. Unfortunately, I face a number of hurdles, one being that the data collected was difficult to translate into a video. More importantly my search for a tool that would be able to create this time lapse proved futile. I tested out Popcorn Maker, (I recalled someone once explaining how easy it was to use, but also the ability to add comments to the videos) However, when I signed up and started using it I realized that I can only create a video from already published media on the web. Not wanting to duplicate some steps and publish material online to then use for a video, I decided to use iMovie, which I surprisingly had never used (Final Cut Pro was my program of choice.) As I started to compile images and graphs onto the program, only to realize that I couldn’t truly translate what I wanted to do with the data using this program.

I eventually, and for the sake of time decided to stick with an info-graph which you can find HERE. I used the site infogr.am to create this graph, it is one of the many tools that are available on the web that can create info-graphics from raw data.

In addition to the info-graph I created, I decided to look into and present my daily consumption which varied from day to day, especially on the weekends.

Day 1 – Wednesday, not a complete report since I started Rescue Time in the afternoon.

Wednesday

Day 2: Thursday

Thursday

Day 3: Friday

Friday

Day 4: Saturday

Saturday

Day 5: Sunday

Sunday

Day 6: Monday

Monday

Day 7: Tuesday

Tuesday

What became a noticeable media pattern is that I was consuming more social media in the early morning and late night during the day. Whereas during the day I spent most of my time on e-mail, scheduling and ‘learning’ sites.

Over the weekend I noticed that I had more time to catch up on the news. I have to admit as someone who considers themselves a news junkie, the fact that I spent so little time reading the news was shocking. Although, my news reading behavior has changed in recent years and I’ve started to rely more on social media as new source.

Having noted all those observations, I would still place a disclaimer and indicate that the data collected by Rescue Time is not entirely accurate and does not indicate time spent at talks, watching a film or media consumed on my phone.

Jeff’s Media Diary

diary_thumbnail

I decided to present my media diary primarily as a short video highlighting the varied ways media reaches me. Watch it here: http://www.youtube.com/watch?v=TeeHQJxOCtg&feature=youtu.be

This is in no way meant to be comprehensive, and in full disclosure it is a composite of two days.

Putting this together taught me a few key lessons:

* I’m nearly always consuming media — I was surprised by just how often. It depends on your definition of media, of course, but even when I was having a conversation with my wife or a friend, I noticed that there was often some form of media playing in the background (a TV in a restaurant, kids music at an indoor playground, etc.). And as you can see in the video I listen to podcasts on my iPhone whenever I’m walking, riding the T, or doing chores. So it’s rare that I go for more than half an hour without some kind of media input while I’m awake.

* Nearly all media I consume is digital, but I’m holding onto some print, mainly newspapers (Boston Globe and student newspapers) and a couple of magazines (the New Yorker and some cooking magazines). At times that creates awkward workflows, though. For instance, one day this week I picked up a Harvard Crimson when walking past a newspaper box in the law school, and I found an interesting story I wanted to share. So I opened my laptop, directed my browser to the Harvard Crimson online, then Tweeted the link to the story. Switching from print to an online version of the same article was a pain, but a couple of my followers retweeted it and it sparked a conversation with another journalist about the article, so I’m glad I did. I’m not in the habit of visiting the Crimson online, but I try to pick up the print paper while on campus because it’s nice to have the print to read while waiting for class to start. This incident made me realize that it would be easier if I just read the Crimson on my phone or laptop, and I’m sure that’s where I’m headed in the future.

* I guess I’m addicted to podcasts.

Content/Device Breakdown

I did log my computer activity for several days using RescueTime to get a more-detailed sense of my consumption patterns. I also kept a diary manually with major types of activity, since I found that RescueTime sometimes misclassified my usage. Here are some highlights:

* On a typical day I use my laptop for between 5 and 6 hours.

* When on my laptop, my biggest activity is e-mail. I spend about 10 to 20 minutes per day on Twitter (via Hootsuite), and about 15 minutes on Facebook. I do make a point to go to a few newspaper sources throughout the day (The New York Times is my home page and I often check Google News). I’m sad to say I read DrudgeReport every day.

* I use my iPhone to entertain me whenever I’m by myself (this adds up to a couple of hours a day of usage). I either listen to podcasts, check my e-mail, check Facebook, or read an article on the phone. This realization makes me think of that recent Louis CK rant.
PHyBALKNJ5SGymNokTNH_qqgk6eGs8nq8EpDyqhFiyE

Katerina’s Media Diary

Image

Are we consuming media through intermediaries? This exercise was a realization of my fragmented – yet concentrated – media consumption. I constantly live under tight deadlines, I switch browsers and leave traces on devices – such as library laptops – that are not my own.  The Triple Revolution, as described by Lee Rainie & Barry Wellman, has shaped the way I get informed. I get 90% of media online, I follow the trends through social networks and “weak ties”, and interact mostly via my mobile phone.

Realizing that my everyday media consumption cannot be measured by one tool (Rescue Time) and due to privacy concerns, I decided to keep a “totally manual media diary”. First, I retrieved my browsing history from my laptop. Then, I added the one from my mobile phone and kept notes about the use of my favorite applications. Finally, I tried to estimate the percentage of my offline media consumption during the week – excluding phone calls – and dividing it in three categories: schoolwork, entertainment and unwinding. The only limitation of this methodology was  the measurement of the exact time I spent at each activity. However, I estimated that I spent 32 hours consuming media online and 21 hours offline.

INFOGRAPH KATERINA1

Observations

* My digital media universe is diverse, yet unevenly distributed. At home, I consume most of my daily stories, news and entertainment through 3 websites: Facebook, Gmail (personal and professional) and Youtube. My first “entry” to mainstream media (The New York Times, The Atlantic, The Boston Globe etc) is through what Henry Jenkins called Spreadable Media or “user-generated content.” The power of “weak ties” (school email list, newsletters, Facebook updates etc) has proven to give access to a great variety of information.

* I tend to use my Android mobile phone in a similar way: through specific applications during specific times (such as the morning commute). In fact, I mostly engage with news stories on my phone between 7 and 10 am. Of course, multitasking reduces my attention to information and the time I spend reading on the device.

*Video is bad on mobile devices. I do not have cable, nor a television at home so video platforms work great for information, trends and entertainment on my laptop. However, they are my least favorite application on my phone.

*Audio applications are the winners of the mobile battle, but they vary according the the operating system (IOS, Android).

INFOGRAPHIC KATERINA2

* I usually read on a screen. I read news quickly. But do I read what is important? Most of the links I click on, come from “references”: either friends and acquaintances via my Facebook newsfeed or through my schools email list.

* I am still a Sunday morning paper enthusiast. I do not have a print subscription, but I enjoy my digital one. I always print the articles I am really interested in.

INFOGRAPHIC KATERINA3* My offline media appetite is satisfied by coursework and entertainment (books, music playlists) is mostly used as a way to unwind and concentrate.

INFOGRAPHIC KATERINA4

Questions

* Can we measure overall media consumption / satisfaction / loyalty / enjoyment?

* Will mainstream media be able to reach their readers directly? If not, who should determine which stories are promoted on social networking sites?

Kevin Hu’s Media Journal

This exercise in self-awareness of our digital lives was informative and alarming. I’d like to comment on why, how much, and how I consumed media this past week, and what can be learned from this reflection.

Following Erhardt’s lead, I used RescueTime to collection data on my computer usage patterns. This was based on the assumption that, since my days are marked by staring at a monitor, my computer can tell me about my media footprint. That’s not the case, as we’ll see. A summary histogram of the six days since Thursday 2/6 is below, with applications/tabs on the X axis and hours spent on the Y axis:

KZHWeeklyHistogramBreakdown

Localhost:3000 is a development URL, so time in that category + sublime text 2 + iTerm are together the time I spend writing code. The second and eighth categories sum to the time I spend playing the video game League of Legends, which is scary (bothersome question: where do the rest of the 168 – x hours in a week go???). A list of the twenty categories in which I spent over thirty minutes is below:

KZHWeeklyList

For completeness, here is a stacked bar chart with days on the X axis and colors signifying different categories. We can see that, while my computer time varies, the distribution of time is somewhat stable.

KZHWeeklyStackedByDay

From this tool, I supposedly spent little time on e-mail. That’s totally not true. I e-mail mostly on my phone and iPad, which is lost in this analysis. Furthermore, I would like to know not how much time I spent on an activity, but how many times I checked it. For example, I know that the little time I spend on the computer checking e-mail is likely due to habitual inbox checking rather than composing messages.

Speaking of my phone, RescueTIme does not capture the hours of pre-sleep phone Redditing costing half an hour a day and probably a substantial chunk of well-being.

But do I really spend no time reading articles or books? Here’s the moral of the rant: most important pieces of media I’ve consumed — those that enriched my understanding or changed a perspective — were not on the computer.

KZHMediaDietBooks

Three were by print: the papers “Visualization and Cognition” by Bruno Latour and “Modeling games in the Newtonian World” by David Hestenes (both via Bret Victor’s 60 over 60 list), and chapters 3-12 of Hobbe’s Leviathan (pages 20-90 in my copy). My print reading was six hours spread over Saturday and Sunday.

In contrast, I listened to the audiobook version of The Better Angels of our Nature by Steven Pinker (paired with Hobbes and recommended by my advisor Cesar Hidalgo) during my walks to and from the Media Lab. That’s 30 minutes every day, and summed to around three hours. Similarly, I read On Intelligence by Jeff Hawkins on my kindle for about 15 minutes (chapters 5-9) before diving into compulsive pre-sleep Reddit-ing.

But what about news? Sadly I realized that most of my knowledge of current events is through word-of-mouth or Facebook statuses. Very little is through reading extended pieces offering thoughtful analyses, which is alarming.

If I were to perform this experiment again, I would do more comprehensive and rigorous accounting of media consumption on all platforms. I would like to understand what types of news I do read and should read, and also how much time I spend on one device versus another.

Aleszu’s Media Diary

mediadiary_AleszuHow I harvested my data (a self-scrape using IFTTT)


The breakdown of my 13 and a half hours of media consumption over 6 days revealed some interesting patterns.

– I listen to a heck of a lot of podcasts. Well, I used to work in public radio. They’re incredibly efficient at giving me news. (No click bait and barely any ads)

– The only entertainment media I consumed was music and that was 22% of my consumption.

– My breakdown of news by language was interesting. 25% in a foreign language. I’ve been reading a lot more Brazilian outlets since my trip there.

– My week is interesting to look at. I consumed the most on Friday and on Monday. Monday I know was because I spent lots of time walking and at the gym–so lots of podcasts. Friday I can’t think of anything besides a lot of free time to sit around and surf the Internet and read.

– Most articles came from Feedly, most radio from NPR/PRI. Seems about right.