Thariq’s Media Diary

Hypotheses

I come from an engineering/computer science background, so my interest in this assignment was mapping my news data programatically and doing interesting data visualizations. I’ve learned that data visualization is often easiest if you start with a hypothesis, because then you know what you’re looking for, and even the lack of a result tells you something. So I made two hypotheses about my news reading habits over the past week:

Hypothesis #1: I get most of my news from social sources, such as Facebook & Twitter. The ‘legitimate’ news source I read most often is the New York Times, not because I visit the website, but because the links that are shared tend to be from there. However, all of my news reading is dwarfed by Reddit usage (which is mostly not due to  .

Hypothesis #2: A large amount of news that I’ve read has to do with the Chapel Hill tragedy. Being a practicing Muslim and very involved in the community, the story of 3 muslims being killed execution-style in a possible hate crime has dominated my news feed for the past week.

Methods

Empirically, I know that I do almost all of my news reading online and on my computer, so I only analyzed data from my laptop computer.

I installed RescueTime and other existing tracking options, but found that they not useful in tracking the sources of my traffic, especially only for news. Instead, I decided to query my Chrome Search history to be able to trace my activity. This was done using node.js and sqlite3 to make it easily reproducable on other people’s computers if the data is interesting.

The GitHub repo for the code is here: https://github.com/ThariqS/FutureofNews-MediaVisualizations. It is currently poorly documented and doesn’t show you visualizations (only results) but I’m uploading it on GitHub to motivate myself to polish it up.

Results

Finding #1: Sports dominated my history results. 81% of my news-related history entries were sports related from ESPN & Reddit (I read a large amount of e-sports news on Reddit). The nature of the way I read sports news is fundamentally different from how I read traditional news. Sports games change more often than news stories, more time is spent tracking and staying updated (over 80% of my news-related history was for sport stories).

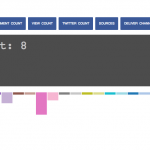
Finding #2: The news sites I visited

Screenshot 2015-02-18 01.14.16

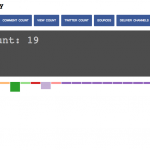
Finding #3: The sources of my news could be divided into 4 different areas: (url bar, google, social and other news stories). Interestingly, I found that the largest trigger for me to read news was to be on a news site, many of the articles I read came as branches off news sites I was already on. Google and Twitter were close seconds. Unsurprisingly, little of my news came from me directly going to the urlbar and typing in ‘newyorktimes.com’.

Disappointingly, though I think much of my news is through Facebook, I was unable to get exact numbers on Facebook usage, due to a limitation of the Chrome history storage and how facebook processes links.

Screenshot 2015-02-18 12.33.33

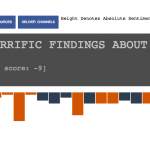
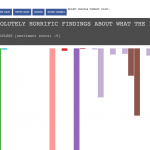
Finding #4: Word Cloud/Topic Generation

Discerning the topics of the news articles I read was difficult, given that I only had access to the titles of the pages. Without being able to apply some more advanced natural language processing techniques, I simply made a wordcloud out of the title words. Some key highlights that stick out to me are: “Hackers”, “Isis”, “Senate”, “Muslim”, “Storm”

Screenshot 2015-02-18 12.18.09

Further Work & Weaknesses:

I know intuitively that a large amount of my news comes from Facebook, but it appears that this method I used is inaccurate in tracking links originating from Facebook.

Secondly, I would be interested in the news I read through osmosis, i.e. news I see through scrolling through Twitter & Facebook. I may be aware of these headlines even if I don’t know anything more than the introductory blurb for the story.


Posted in All

Carol’s Media Diary

I installed RescueTime on Chrome and on my Android device. One of the interesting things I noticed is that, by default, RescueTime considers news reading as unproductive time. You can change that, but I started thinking about what productivity really means, as the concept may vary greatly depending on you field of work. I also had to make some corrections, for example, in cases where I watched videos on YouTube, but they were instructional and couldn’t be accounted in the entertainment category.

I had a look at the graphs provided by the application and took some notes. It may seem a little obvious, but it was interesting to see that most of my media consumption happened at the weekends. Also, I realized I haven’t been reading much news, for many of the articles I read in that category were actually opinion articles on culture, music or art.

So yes, I noticed is that I have a “high entertainment” media diet. But the information may be a bit misleading because I listen to music on Spotify or YouTube while working. For that reason I chose to restrict the color palette so that periods of media consumption higher than 3 hours wouldn’t impact the visualization too much.

I also grouped the media consumed by format: video, audio or text & other. This was not very accurate, for I simply tried to remember what was the media format for that link. But it is still interesting to notice that a big part of the media I consume is in text format. Photo galleries and some applications that were hard to define are grouped in the “text & other” category, but they represented a very small part in the whole.

media-diary-carol

Posted in All

Audrey’s Media Diary

How I Lost my Snow Day Trying to Read all the News on the Internet Intro_08

It’s Sunday, outside is 5°, and I won’t go out : perfect day to catch up on the week’s news — or so I thought. Here’s how and what I read/heard/watched while the world was ending, buried under 70 inches of snow.

Alerts

Opening eyes around 7.30, the first thing I do is check my phone (I know, it’s a bad thing to do). I read a blurry bunch of news notifications that popped on the screen while I slept. I only read the notifications, without opening any of them. This morning, they all describe the terrorist attack that happened in Denmark. This actually can be all that I do to remain informed on a busy day : seeing the world only through media notifications, trusting my apps to tell me only what’s essential, and never reading anything further. But it won’t be enough for a snow storm day, locked inside.

————-

Reveil

I bother reaching for my glasses and my iPad, and let myself drift from link to link, starting with e-mail newsletters (Medium and LeMonde.fr). But Facebook pops up on the screen without me even thinking, and transforms my quest for news by taking me to a post-Valentine’s day feed. I say to myself that this is a little monochrome and irritating, but I end up reading a bunch of Valentine stuff I had no intent to read for an hour, like a map of the world’s single published on Medium. I emerge from this lukewarm love bath thinking about how I didn’t see anything about the latests event in Copenhagen pop up in my feed. So I finally take a deliberate decision and open The Guardian’s app to read about it. 15 more minutes.

————-

Breakfast

Next to some almond biscuits my partner and I put on the table, ends up a smartphone that shouts what NPR One app’s chooses to tell us about the world this morning. We listen closely when a report on Copenhagen comes up. And later complain about a Valentine’s day story (am I trapped?) we had heard two days before. We just turn the whole thing off when a game show comes up, feeling like we didn’t get the news we came for. And we ask : why did we not just play a podcast instead?

————-

Bathroom_01

I’m sorry that I have to drag you into this truth about media consumers : they often read you from their bathroom. Unfortunately, I make no exception — and open the NYTNow app when I get there. I always say I love this app because unlike the NYT homepage, it makes choices, and doesn’t flood me with tons of things I might not want to read. I scroll through the “News” section for a while, reading stories and saving a bunch of others “for later” — more stuff from Copenhagen, although the situation is unclear at this point. Then I get to my favorite part of the app : the “Picks” — where the editors have chosen for me what I should read out of the whole Internet. I rarely click through to any content. I just feel good knowing that these things exist.

————-

Laptop

In an attempt to get some work done, I open my laptop to the hundred Chrome tabs from my last Internet time. Two starred e-mails later, the sound of Facebook pops in my ear. And in a heartbeat, I’m scrolling down my Facebook feed. This time around, I am flooded with the news of the day : snow is everywhere, more snow is coming, when will the snow end? My Tweetdeck is next on my instinctive desktop habits. I open a bunch of tabs, and jump from one content to another : The Guardian, Medium, Vox, Reddit, NYTimes, Quartz, NYMag… 90% of topics are about the U.S., and all contents are in English — which may seem weird for a French journalist, now that I think about it. I read a lot of stuff but the only thing that really strikes me is the Obama interview Vox did : good format, great interview.

————-

Pocket_09

At night, I find the time to read the choices I’ve actually made on the whole Internet: the articles I’ve saved in Pocket, the read-it-letter app. But while I dwell into reading a bunch of my saved contents, this media diary makes me self-conscious. What is it that I actually choose to “save to read later”? First is an obvious one : (too) long pieces that I’m afraid I will never read. Second is a little less obvious : bookmarking. Things that I actually already read/watched, but wanted to keep somewhere. They’re coming from my favorite sources : Vox, NYT, Quartz, The Guardian, Le Monde, etc. No specific topic surfaces, and I feel like, once more, this saved content is still very much a result of my serendipity habits, rather than the reflection of my own interests.

Vivian’s Media Diary

To keep track of my media content, I used two methods. The first, Rescue Time, to provide a complete look at my online activity and desktop work. That way, I can compare the time I spend reading the news versus getting work done. The second method was much more on the experimental side. I manually recorded what I classified to be ‘news’ as I read it. Although this week isn’t representative of other, more normal weeks, the data probably fits and overall trend in my media habits.

Vivian's RT ShotVivian's Categories

Above is a short summary of my ‘productivity’. Reading the news seems to occupy a fair share of my time, even rivaling ‘entertainment’ which encompasses youtube and spotify (both of which are often used to provide better environments for concentration).

What’s the most interesting part of exploring Rescue Time’s tracking is that I saw very obvious patterns of activity for myself. I know that I tend to tab over to Facebook, Reddit, blogs, and news sites for brief periods throughout the day but seeing how much that adds up is interesting. I’m not sue I care enough to curb it yet – more data needed on how much it helps me de-stress or just plain distracts. It’s also quite consistent throughout the week although none of the ‘tabbing-over’ is planned in any fashion.

Screen Shot 2015-02-18 at 12.01.26 AM

I’ve also learned that I although I feel like I spend the most time on Reddit, I’m actually on Facebook nearly twice as much. Perhaps because the content feels less interesting on Facebook? Reddit’s use of imgur as the image hosting site of choice must also be taken into account as I’m on imgur about 40 minutes per day, rounding my total true Redditing time to 3 H 10 M. Shame on me. Hmmm, however, I know for a fact that I’m on my phone Redditing often while waiting for the bus/train/unicorn so maybe not so much shame?

Given that I’m apparently on email about 8 hours a day (I do actually nearly compulsively check email), it’s not a surprise that a number of my news sources are actually through email. (See Media Diary link at bottom).

With the information I’ve collected manually, I’ve created a visualization to better understand how my media affects me and where I’m actually getting it (email, Facebook, etc.). Although the visualization needs a few more hours of work, it did help me realize that I’ve been getting my news a lot more through Facebook than I expected. I can further explore my visualization and see that I’m often on BostInno.com. This is a pretty decent highlight of Facebook’s role in news in general. Because Facebook is so good at the localized, personalized stuff, hyper-local news service might be a large part of their news pool. At least, it seems like that for me.

Within my visualization, I also included sentiment (using the ‘sentiment’ node package to compute sentiment scores), comment counts, tweet counts, and facebook share counts as a way to see what type of material tends to be shared (negative sentiment versus positive sentiment). Although these visualizations need some more work to get them to that stage of descriptiveness, they do provide some insight into what I prefer to read and how often I am made to feel ‘bad’ by what news I read online.

Obviously, I need to look at more world news  – Boston-based news occupies much of my news reading. I need to reclassify some activities on Rescue Time. I also need to limit my Facebook tab-overs – maybe switch it to BostInno since I clearly go to Facebook for their news most of the time anyway. (Link to website with visualizations coming very soon) EDIT: link is here!: https://media-diary.azurewebsites.net/ Click on buttons (preferably going from left to right because there are bugs . . .) to navigate to different views. A short description exists next to the buttons to somewhat explain the graph. Click on bars in the graph to see additional info.

Posted in All

Austin Hess Media Diary

I started this assignment in an effort to make a real timeline out of my media consumption. I knew I wanted to track my reading speed and volume, not in some cruel optimization of reading efficiency, but rather just to see what I find. It turns out that, at least when I’m busy, I consume articles in chunks: several in a sitting, possibly with a long piece thrown in that I had been waiting to read. And I seem to read opinion, essays, and features much more slowly.

Here is the link to the animation: http://austinhess.github.io/media/

Luojieqi’s media record

Screen Shot 2015-02-17 at 11.38.09 PM

I am sorry , I could not use a right tool to make a smart graphic of my media consumption record .
But I made a written diary ,and I found that my media consumption focus on 3 things:
1 The first one is using WECHAT (Chinese social media) to watch what is happening in china and what are shared within my friends.as to the first behavior , My psychology is afraid of missing something important or a kind of habit. as to the second one, my psychology is to keep in touch with my friend. I read t he articles they shared and I found , most of them are not valuable. and most of my friends repeat sharing the same articles. they are killing my time ,the first half an hour after getting up ,and the last half an hour before I go to bed.
i have been very regret that i spend almost one hour a day on social media (we chat). I want to get red of the habit.
2 use google search or Nieman facebook for my work. that is very practical and valuable ,and i do not think I have wasted my time.
3 I found I rely on the social media ,which I am used to . Facebook ore tweet is not my daily social media consumption.I even do not be used to reading news in English.

Posted in All

An Attempt to Sort My News Sources

Disclaimer: Due to my non-journalistic background, my media reading behavior should exhibit some substantial differences.

I usually have a good appetite for a variety of media contents. However, I am usually lazy to look through traditional news media rigorously to find good contents, so I resort to places like Facebook. Surprisingly, over eighty-six percent of posts are written by news-related accounts, which makes Facebook a source of news aggregator. The collection includes three streams of information: traditional organizations like BBC, CNN, Wall Street Journal, New York Times; technology-based websites like TechCrunch, Mashable, Popular Mechanics; Academic publications like Nature, Science, and Technology Review (I mainly read their daily arXiv paper selection). Another source of information on Facebook is the Chinese articles shared by friends. There are several news websites (CNN, Time, WSJ, Bloomberg) that I regularly browse through for important articles. Technology and other miscellaneous websites include those technical articles that I simply enjoy reading in my spare time. I am also subscribed to several mailing lists and I regularly receive news update links, as well as recommending Quora and LinkedIn articles.

Screen Shot 2015-02-17 at 11.26.53 PMScreen Shot 2015-02-17 at 11.19.43 PM

One particular information source is PTT. This is a very popular Taiwanese bulletin board system site that has very high user traffic in the age group (~100,000 simultaneous login accounts). There are many “forum”-like boards for posting articles and commentaries. I especially like this media outlet because it is void of algorithmic manipulation, where visibility is only determined by popularity in responses. Although the end result is the sheer amount of noisy contents, I still use it as the main source of Chinese news articles.

In terms of viewing behavior over the week, I tend to read more technical articles during the week, with increasing readership on Facebook and PTT articles. My weekday reading schedule is focused on three time slots- morning, noon, and midnight. For weekends, I indulge myself to greater schedule flexibility to read whenever I feel like reading.

Screen Shot 2015-02-17 at 11.24.50 PMScreen Shot 2015-02-17 at 8.59.20 PM


It may seem PTT dominates the amount of articles I read. However, there are some subtle differences in my attention of article browsing. Usually I have a much higher impression of article volume on sources like PTT and Facebook, so a good amount of title summarizations are available at first look. When I click the links, I often just want to quickly expand on the news title to have the overall picture of the story. I do it differently when browsing news and technology-related websites, heavily investing my brain power concurrently thinking and reasoning during reading.

PTT is a rich source of Chinese news articles with sparse expert response. However, due to the bulletin format, contents are easily flushed from user view. Out of 821 articles posted on February 17th, only 134 gained substantial popularity, with merely 5 articles containing interesting content.

I also experimented with my Facebook wall for the date of February 17 and collect the list of accounts whose posts appeared on the wall. I observe the total times the post appeared on my wall and how often I would prefer the link content.  Based on the plot of impression number against click through probability, friends that post more often tend to deliver interesting contents. This shows Facebook knows not to bother me with users who post too often for users that are both active and informative. Not so with news accounts: my wall is bombarded with irrelevant articles. At least in my case, Facebook’s algorithm is too conservative to suggest articles on a topical basis.

Untitled

Posted in All

An Account of Tracking and Sharing my Information Diet

So I was pleasantly surprised when I heard about our first homework assignment for this course. As it turns out, I have been tracking and also sharing parts of my browsing activity for some time now. To accomplish this, I use an application called Eyebrowse, which was developed at MIT CSAIL a few years ago and which I took over the development of when I came to MIT. It is an application that is somewhat similar to RescueTime but instead allows users to be selective about what they track, and then shares that information publicly as a way for people to find interesting content from each other and converse with other people while browsing.

Users create an account on the website and install a Chrome extension. They can then choose to whitelist certain domains or selectively publish their visits to certain pages, which the extension tracks and pushes to their feed. You can also do other things like see who else has been on the page you are on, post comments or chat on any page on the web, or follow other people to see visits from their feed.

Here is a link to my feed: http://eyebrowse.csail.mit.edu/users/amyxzhang

And here is a screenshot:

My eyebrowse profile, showing my most recent shared browsing activity.

My eyebrowse profile, showing my most recent shared browsing activity.

As you can see, my profile contains the webpages I’ve chosen to share in reverse chronological order, links to visit them, ability to filter by keywords and time, and tags added by myself. There’s a public API for anyone to play with the data themselves (http://eyebrowse.csail.mit.edu/api/v1/history-data?format=json&user__username=amyxzhang&offset=0&limit=10). There’s also a visualization page containing some dynamic visualizations with the ability to filter, save as static image, and embed as a widget on a webpage (http://eyebrowse.csail.mit.edu/users/amyxzhang/visualizations?query=&date=last%202%20weeks)

Unfortunately, wordpress.org does not allow code snippets so I can’t embed the dynamic widgets. You’ll have to visit the webpage above for those. However, here are some static images of my activity over the last two weeks:

A word cloud of page titles from webpages I visited in the last two weeks.

A word cloud of page titles from webpages I visited in the last two weeks.

My browser visits broken down hour and by my top domains over the last two weeks.

My browser visits broken down hour and by my top domains over the last two weeks.

My browser visits broken down by day of the week and by my top domains over the last two weeks.

My browser visits broken down by day of the week and by my top domains over the last two weeks.

One can clearly see that I spend quite a lot of time on coding websites, especially this last Monday, when I decided to spend the holiday upgrading this very application from Bootstrap 2 to 3.

Since I’ve been collecting my browsing data for a long time now (almost a whole year I believe), I can also go much further back to notice larger trends. Here are those last two graphs again except over the last year:

My browser visits over the last year broken down by time of day.

My browser visits over the last year broken down by time of day.

It seems that I’ve been getting better about stepping away from the computer before 2AM, at least in the past two weeks compared to the last year. And since activity on StackOverflow is a good indication that I am coding, it seems that I’ve conducted a lot of this very late at night. This graph also makes painfully clear how late I start the day on average. I’m also surprised by the presence of Mashable in the top 10, as it’s a media site I never really thought I visited often.

My browser visits over the last year broken down by day of week.

My browser visits over the last year broken down by day of week.

Looking at days in the week, it’s interesting to see that my coding work (or visits to StackOverflow) increases from its lowest point on Monday, reaches a peak on Thursday, and quickly tapers off once I hit Friday. My media consumption however remains fairly steady.

Now for some more high-level reflections of this whole experience. Before two weeks ago when I got this assignment, I had only whitelisted certain web domains that I was reasonably comfortable sharing with the world – things like Wikipedia, the New York Times, and various coding and research related websites. Beginning two weeks ago, in an effort to capture more of my media diet, I started whitelisting everything that remotely resembled news or media (excluding social media – I still wasn’t comfortable sharing that), so all my embarrassing visits to BuzzFeed and random gossip sites were also tracked and shared. The experience was really interesting to me not just to see what I had visited and notice trends, but also in a meta way to see how my tracking and sharing of my browsing history caused me to browse differently. Particularly this experience made me much more mindful of my media consumption and careful and picky about how I chose to spend my time online. For instance, in Eyebrowse, there’s a feature that makes it possible to at any moment turn off all tracking on even whitelisted domains, effectively turning off Eyebrowse as if it were in incognito mode. By having that option available, I became more thoughtful and aware of what I was doing when I had the option to choose to be privately or publicly browsing. And while tracking and visualizing the data played a role in that, it was the added step of then having that data be shared and choosing when and what data to share that made me very conscious of my bad (and good) habits.

While I hadn’t explicitly developed Eyebrowse for this purpose before, this experience has made me think of the potential benefits of a social app like Eyebrowse towards not just monitoring but keeping accountable one’s goals for their information diet. Indeed many current applications related to maintaining exercise habits and food diets incorporate social sharing to provide a measure of accountability and support. And after all, why shouldn’t we be as mindful of what we feed our minds as we do our bodies? If you have any thoughts around this, I’d love to hear it! As I continue to develop Eyebrowse, I will work on adding features to make this process easier, included better aggregate statistics and visualizations and easier ability to share these reports (like little media diaries!) on social media and personal websites. I’ll also build in more levels of obfuscated sharing, for instance the ability to share that I’m on Facebook but not specific pages.

If you’re interested in seeing where this goes, I encourage you to try out Eyebrowse! I’m still actively developing it and would love to get some more users as well as any feedback and bug reports. I haven’t released it to the public or anything yet – just publicized it around MIT CSAIL and my research group – so the only people using it right now consistently are me and my advisor, David Karger. By default, nothing is tracked when you install the extension. If you have more questions, feel free to contact me (axz@mit.edu) or read our FAQ: http://eyebrowse.csail.mit.edu/faq.