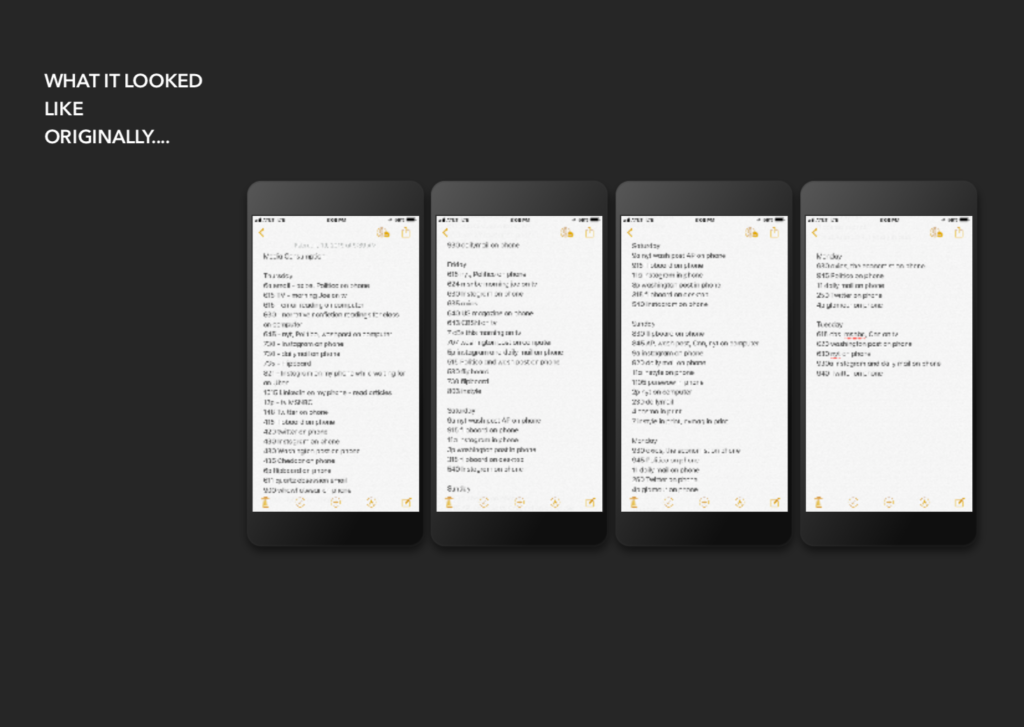

While exploring ways to log my media intake, I played with a few ideas of visual representation. Perhaps collection of photographs of every piece of media I consumed, or short, 1 second videos. Quickly overwhelmed by the vast amount of media consumed, with 30 new videos and photos over the course of just a few hours, I decided too comprehensive a log would prove unmanageable and unsustainable for the week. In an effort to simplify, I began exploring the idea of graphically portraying that intake. While beginning some graph development, I checked my second most used app behind gmail, Google Calendar.
What a simple design. What clean colors. What a nice way to map how I distribute my time.
And so I began to log my media intake on the calendar. Again, the media log quickly overcame me and my calendar began to flood and overwhelm, so I decided to stick with the structure but move away from the platform. And voila, a visualization was born!
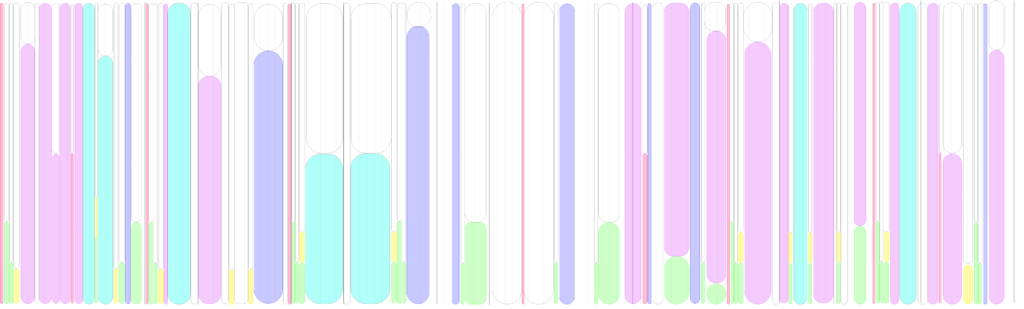

The x axis is time, the y axis my attention. For each section, my attention is distributed between 1. people and human interaction (white) 2. Spotify, music, and podcasts (green) 3. ads (yellow) 4. entertainment, such as a Cherry Glazer concert or Brooklyn Nine-Nine (blue/purple) 5. class lectures, videos, and workshops (teal) 6. Instagram and Reddit (red) 7. work media such as readings for courses, research, and media content I produce (pink). For many chunks of time, my attention is split between people and media, or Spotify and readings.
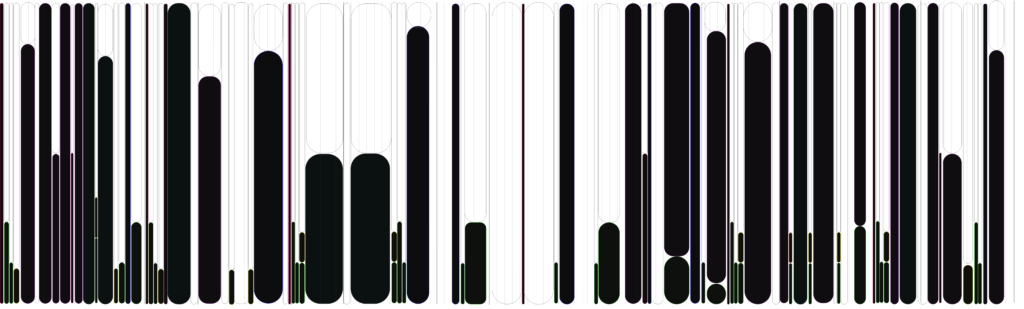
Blacked out to see the contrast in media versus non media attention, overall you can see about 50% of my time is devoted to media intake, be it the only thing holding my attention or just music running in the background. A dip in media consumption over the weekend in the middle of the graph comes from a visit to a friend’s family in Western Mass. During that time, spent little to no time consuming media until, only chatting, playing games, and watching a little brother’s basketball tournament until the All Star game that night. I included an all day workshop on Saturday, the two teal half tall chunks, where we needed to both read and consume content produced by community organizers, but also engage with people consistently throughout the day.

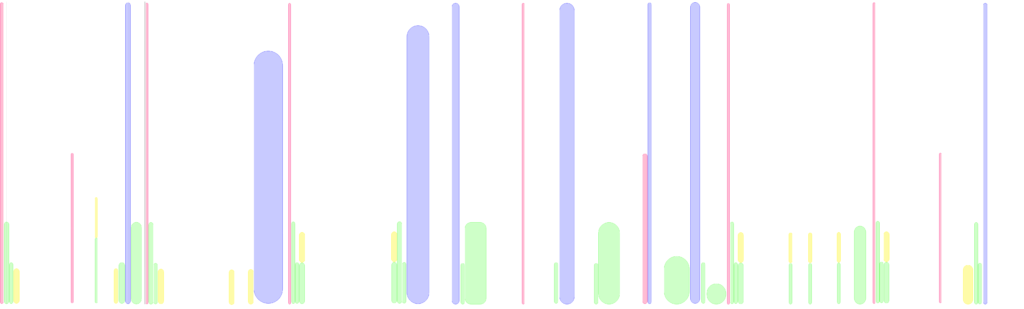
Finally, I separated out work from fun. Instagram, Reddit, Spotify, Podcasts, and some news fell into my entertainment or fun graph, the second of this set. While the blue shows concerts and tv shows and is somewhat irregular, taking up almost all of my attention at one time for an extended period of time somewhat irregularly, the green of music and podcasts and the red of instagram and reddit were regular and somewhat constant throughout my week, but took up much less attention space. I get my news sometimes through podcasts, but often spend little time diving into it.
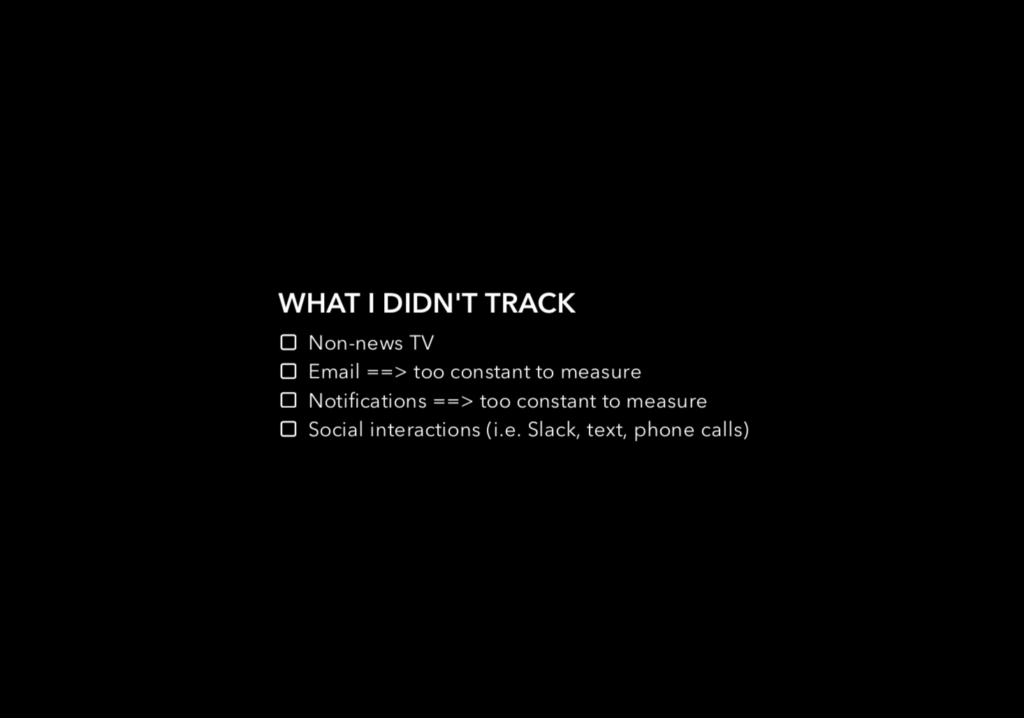
Something that was difficult to track was non-work article consumption. I read news articles and watch videos, but for quite short periods of time regularly and often. I am not a news junky, but get updates from the NYT, WaPo, WSJ, and a few other news outlets. While some articles I will read, I rarely anymore spend extended time on the sites themselves or sifting through stories.
Work was much more difficult to separate out. In classes and research, I read many stories and news stories for work and research, but that have an entertaining quality to them. It was a much more difficult to make labels for the work, and different media started clumping together to form just two groups: out of class work and in class work.
A few takeaways: I listen to podcasts or music frequently throughout the day as background or while doing other work. I have worried I spent too much time on social media apps and entertainment and have put an effort to calm it down, but see the cycle of low work, high work that naturally occurs throughout the week and weekend and find it healthier than I anticipated. I am a bit surprised about how little news I consume. Because the articles I read in work are old but politically minded, it often feels as if I am in touch with what is going on in the world currently. Many of the meme accounts, instagram accounts, and subreddits I follow are feminist, socialist, political, etc. and touch on a lot of news. But I do not go on NYT or WaPo like I used to. I believe it is pretty intentional, but I wonder if it is helpful or constructive to the public sphere.
I tracked my media use from 2/14 – 2/19 using a combination of RescueTime and a notebook to log non-screen media consumption. Reflecting on my week and taking a look at the data I collected, a couple of things surprised me.
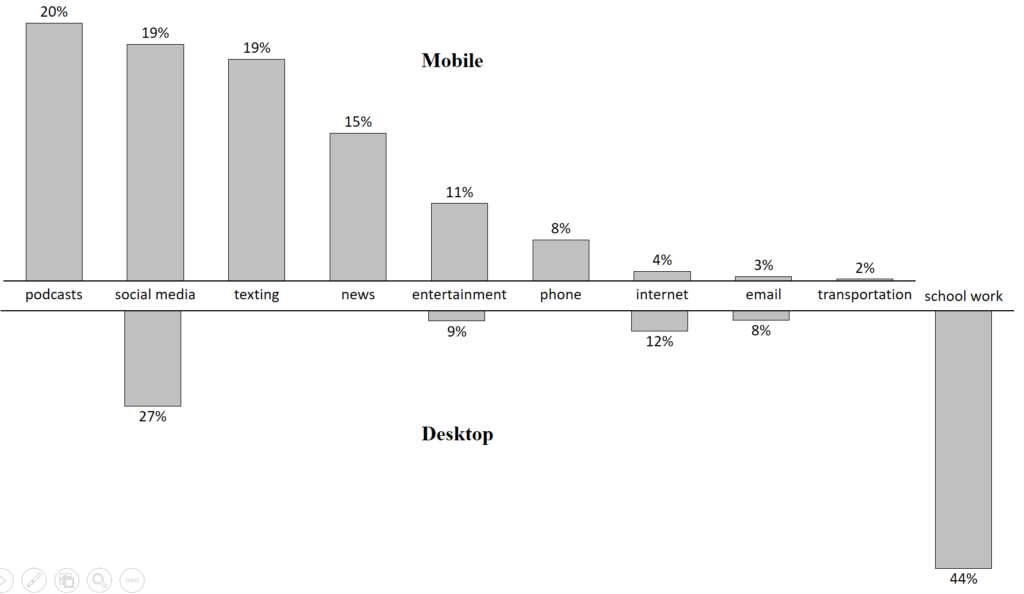
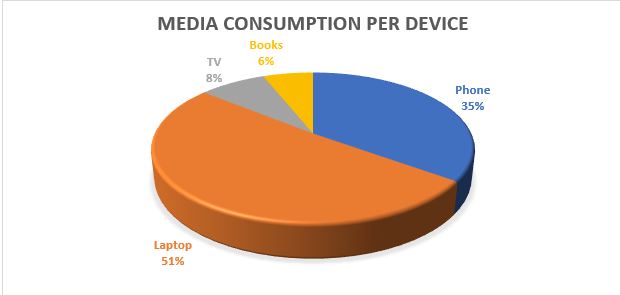
Taking a closer look at the data, it’s clear I consume more media on my phone than my computer (though I wanted to show a percentage basis here, the absolute numbers aren’t so stark). I tend to use my phone for social and non-work uses while I use my computer for schoolwork and professional tasks.
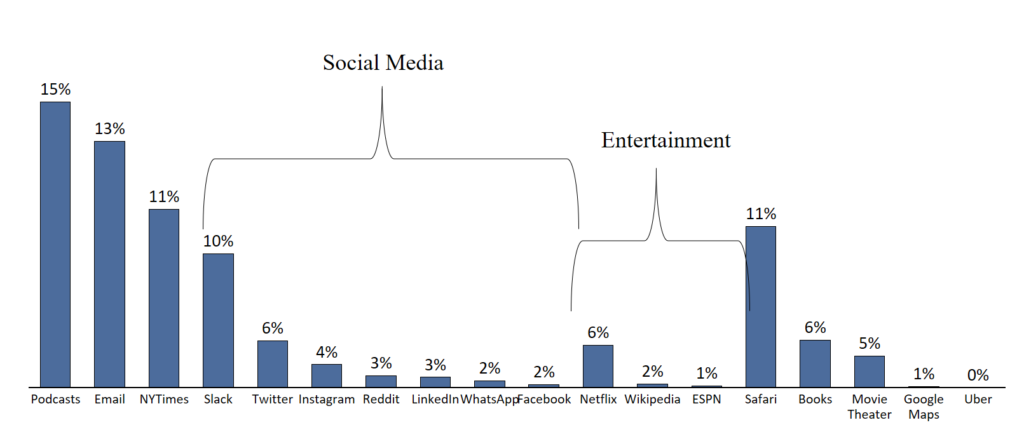
Looking at specific apps, I’m getting a lot of my media on social media, and, as mentioned above, almost all of my news from the New York Times. Also a little bit strikingly, I spend very little time reading for pleasure (aside from news), as shown by the only 6% of time with books. One detail with this chart is the podcast number is inflated because I often listen to podcasts while I multitask on my phone.
In closing, a few takeaways for me based on the exercise:
For me, this exercise was a wake-up call. I’ve always thought that I was a moderate consumer of media, and that is why realizing that I spent around 8 hours per day consuming media this week was a revelation.
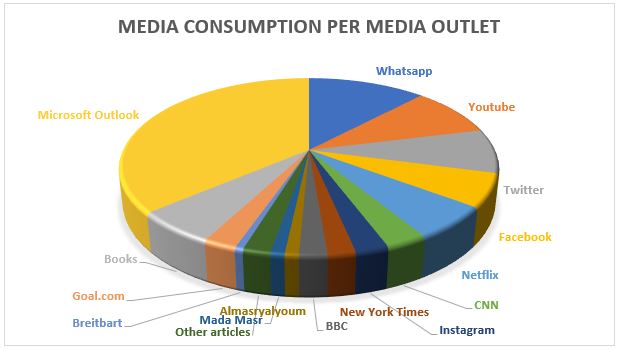
The diagram below shows my consumption per media outlet. I spent a significant portion of my time (3 hours per day) using Microsoft Outlook, which is the application I use for work. This diagram made me realize the amount of time I spend sending and receiving emails. I also noted the number of times (12 times per day) I used the Outlook app on my phone to check if I have received any new email. Social Media is another outlet that takes a significant portion of my time. This observation can be attributed to the fact that most of my family and friends live abroad, so social media offers me the best method to connect with them and know their news.
The other observation I noted was that I only spent 10 minutes per day on articles that I’ve opened through Facebook and Twitter. I honestly excepted this number to be higher.
I was also surprised to realize that 51% of my media consumption was done through my laptop. I think it might be because during my work day I sometimes take some mental breaks by reading some news and entertainment articles. I also sometimes use my laptop for viewing videos which might have attributed to my consumption pattern.
Another revelation for me was the significant number of mediums I consumed that are being tracked third-party data-tracking applications. By using “Ghostery” a web extension which allowed me to monitor and block these applications, I realized that third parties are tracking 45% of the media I consume.
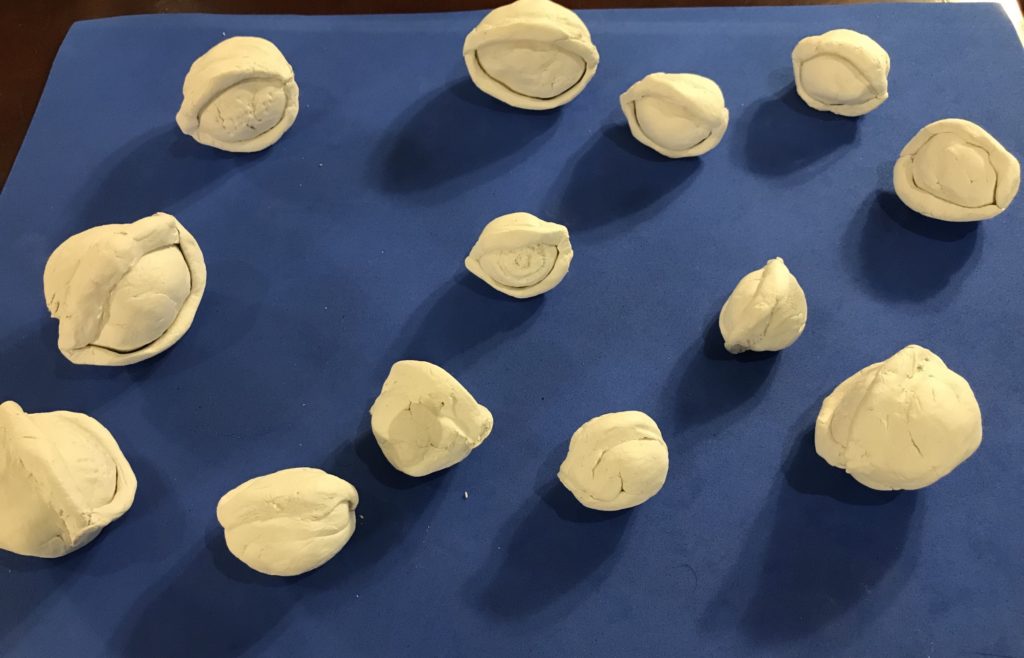
I have created the sculpture below to express my feelings regarding being continuously tracked by third party providers and by the media outlets I consume online. In the middle, there is the eye of the user being monitored by different digital eyes (representing the tracking of information) that are surrounding the user from everywhere, designed to make the user feel that the experience is as natural as possible so that the trackers can continue to mine data.
Overall, this exercise was eye-opening for me, and it allowed me to notice specific patterns in my consumption that I did not expect. It also prompted me to reconsider the way I consume media.

As Visiting Assistant Professor at the Media Lab / Social Machines, Dimitra studies the diffusion of “fake scientific news” in social networks. Drawing links between pseudoscience, populism and health literacy, she focuses on the anti-vaccination movement to provide a key venue wherein mis- and dis-information can be studied.
Dimitra is an Assistant Professor of Journalism at the Aristotle University of Thessaloniki in Greece and has over 10 years of teaching experience. Her current research interests lie at the intersection of social media, journalism, and society.Alongside her academic appointments, she has worked as consultant in PR and communications.
She has been recently granted a Marie Curie Global Fellowship from the European Commission which is awarded to the most promising researchers from the European Union. Under this fellowship, she will pursue her research for two years at MIT and for one year at the University of Zurich, Switzerland. With her current project, Dimitra aspires to enhance the efficiency of science communication professionals and science journalists and provide insights that will empower public health policy makers to introduce fake-proof health literacy initiatives.
She is a self-taught avid knitter and a mum of two – 4 year old Eva and 9 month old Aris.
Overall this felt like a week of frustrated habits as I adjusted to term; in each of the four discovery mechanisms for textual media I use (social media, directly visiting websites like some kind of primate, email, RSS), I kept opening something automatically before realizing that I had urgent homework, research, organizing, partying, or fevering to attend to. Starting, however, from the means of discovery:
Continue reading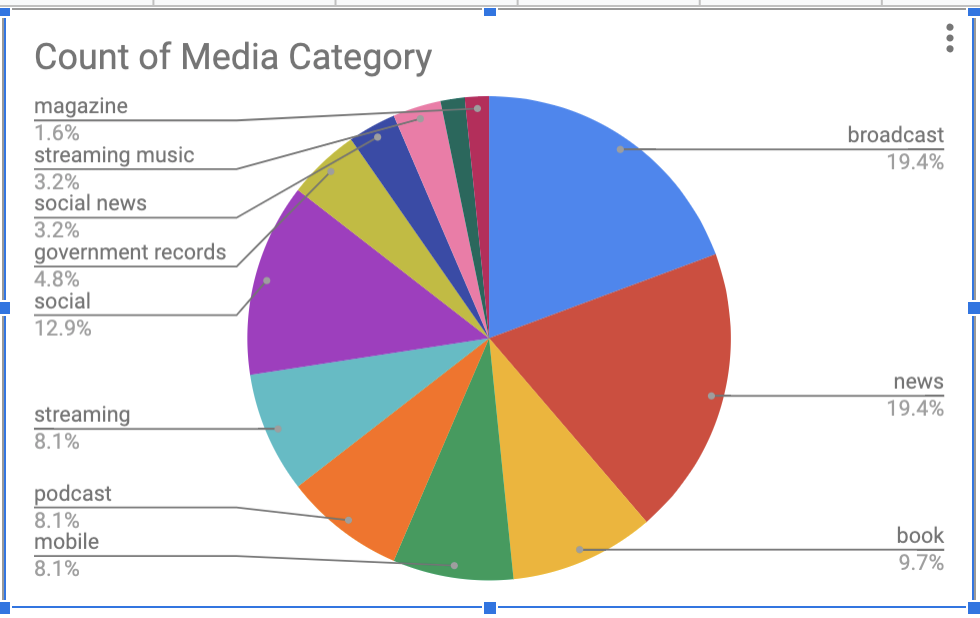
Here is my diary, the second tab has some rudimentary analysis — there are deeper, more interesting ways to go at this I’m sure. This was a fun exercise, and I found a bunch of different ways to gather data on my media consumption. My iPhone’s weekly report showed me how many alerts I get per day (65!!), Google tracked my YouTube TV watching (daily Jeopardy habit). But most of all I realize that very few minutes go by in a day without me consuming some type of media: podcasts, music, books, etc… I’m constantly plugged in.
 The meteoric rise of the field of Artificial Intelligence (AI) has had a
remarkable influence on various aspects of our lives, and this influence is
only expected to rise. AI has already disrupted the field of journalism with
the introduction of “Algorithmic journalism” (Dorr,2015). Algorithmic
journalism involves a “software that automatically produces texts in
natural language from structured data.” Various economic reasons are
driving the rise of AI within journalism. First, AI spares journalists the time
to draft articles and news pieces that are relatively uniform such as daily
news reports about the performance of the stock market. AI’s use in editorial
tech helps writers and journalists review their pieces promptly. There’s also
an argument that AI may help reduce the biases in certain stories, but given
that the algorithms drafting the content may itself include the biases of the
person who coded them, this argument still has its flaws.
In its bid to enhance its ability to reap the fruits of AI in journalism,
Reuters has introduced an AI tool called Lynx Insight (Kobie, 2018). This tool
aims to augment journalists and writers rather than replace them by providing
them with analytical tools that synthesize big data in a way that nurtures
their journalistic role. Lynx Insight will analyze a vast amount of data to
identify any interesting patterns or topics that can allow Reuters the
opportunity to publish content that is innovative and pioneering, and at the
same time fits with the readers’ interests. Lynx Insight aggregates the data
and sends the journalist a message with a brief about any interesting patterns
with some background about the story or topic. The App associated with the tool
provides journalists with a live feed of updates regarding any possible
breaking news stories.
AI’s growing influence in the field of journalism may have significant
implications on the future of news and media. AI may help journalists
personalize the news according to the interests of their audience, which may
enhance the appeal of the news and its readability. Its ability to reduce the
cost may allow new news and media outlets to enter the field which supports the
democratization of the field and may provide a competition that can support the
quality of the content. Unfortunately, this competition may also lead to the
deterioration of the content with news outlets fixated on competition and
monetizing content rather than nurturing the field and improving its appeal.
Over-dependence on AI tools such as Lynx Insight may reduce the journalist’s
sense of agency and innovation ability. This dependence may be destructive to
the field of journalism if there are issues with the algorithm, or if the data
used by AI has significant flaws.
Kobie, N. (2018, March 10). Reuters is taking a big gamble on AI-supported
journalism. Retrieved February 12, 2019, from
https://www.wired.co.uk/article/reuters-artificial-intelligence-journalism-newsroom-ai-lynx-insight
Seth, C. (2016). Mapping the human–machine divide in journalism. The
SAGE handbook of digital journalism, 341.
The meteoric rise of the field of Artificial Intelligence (AI) has had a
remarkable influence on various aspects of our lives, and this influence is
only expected to rise. AI has already disrupted the field of journalism with
the introduction of “Algorithmic journalism” (Dorr,2015). Algorithmic
journalism involves a “software that automatically produces texts in
natural language from structured data.” Various economic reasons are
driving the rise of AI within journalism. First, AI spares journalists the time
to draft articles and news pieces that are relatively uniform such as daily
news reports about the performance of the stock market. AI’s use in editorial
tech helps writers and journalists review their pieces promptly. There’s also
an argument that AI may help reduce the biases in certain stories, but given
that the algorithms drafting the content may itself include the biases of the
person who coded them, this argument still has its flaws.
In its bid to enhance its ability to reap the fruits of AI in journalism,
Reuters has introduced an AI tool called Lynx Insight (Kobie, 2018). This tool
aims to augment journalists and writers rather than replace them by providing
them with analytical tools that synthesize big data in a way that nurtures
their journalistic role. Lynx Insight will analyze a vast amount of data to
identify any interesting patterns or topics that can allow Reuters the
opportunity to publish content that is innovative and pioneering, and at the
same time fits with the readers’ interests. Lynx Insight aggregates the data
and sends the journalist a message with a brief about any interesting patterns
with some background about the story or topic. The App associated with the tool
provides journalists with a live feed of updates regarding any possible
breaking news stories.
AI’s growing influence in the field of journalism may have significant
implications on the future of news and media. AI may help journalists
personalize the news according to the interests of their audience, which may
enhance the appeal of the news and its readability. Its ability to reduce the
cost may allow new news and media outlets to enter the field which supports the
democratization of the field and may provide a competition that can support the
quality of the content. Unfortunately, this competition may also lead to the
deterioration of the content with news outlets fixated on competition and
monetizing content rather than nurturing the field and improving its appeal.
Over-dependence on AI tools such as Lynx Insight may reduce the journalist’s
sense of agency and innovation ability. This dependence may be destructive to
the field of journalism if there are issues with the algorithm, or if the data
used by AI has significant flaws.
Kobie, N. (2018, March 10). Reuters is taking a big gamble on AI-supported
journalism. Retrieved February 12, 2019, from
https://www.wired.co.uk/article/reuters-artificial-intelligence-journalism-newsroom-ai-lynx-insight
Seth, C. (2016). Mapping the human–machine divide in journalism. The
SAGE handbook of digital journalism, 341.
I work at the Harvard Graduate School of Education as an Associate Director for Professional Education and as a Teaching Fellow. I am responsible for managing and developing professional education programs and strategies for K-12 teachers, with a special focus on international audience. I also lead the Middle East Professional Learning Initiative, which is an initiative that aims to support teacher educators and system-level leaders in developing practices, programs, and structures to help improve student opportunities to learn and achieve productive sustainable lives.
My research focuses on civic education, using informal learning to support education in low-income communities and teacher professional development. I earned my Master’s degree in Education in 2017 at HGSE.
I am from Egypt and I actively participated in the Arab Spring which was the highlight of my experience with the impact of participatory media in politics. The Arab Spring also influenced my decision to co-found Mashroo3 Kheir (The Good Deed Project) NGO that focuses on promoting civic education among youth in Egypt.
I’m really excited to join the course and learn from everyone’s diverse experiences.
Shorthand is a platform that enables simple yet stunning visual storytelling for journalists, artists, statisticians, and any storyteller looking to explore dynamic digital means of telling their tales. In a time when empathy and compassion often feel scarce, storytelling with tools like Shorthand re-engage the emotion of an often jaded audience through paced, intentional, and visually dynamic storytelling.
Over the course of my time in academia, I have become quite in touch with how little I know. Everyday, actually, the pool of knowledge, the bank of content of which I am aware I need to learn gets bigger and bigger. So, naturally, I try to absorb as much knowledge as I can just to combat the growth of that pool of uncertainty, but the rate of understanding is always slower than the rate It feels like a sprint, one where I can see the end, but the faster I go, the farther away the end gets. It is an absolute race to learn as much as possible as quickly as possible.
In that spirit of panic learning, I have become an avid speed-reader. I remember having a deep pride in my ability to speed read, to skim, to find the gold nuggets of information in a sea of text at school. The structure of the piece? I know it like the back of my hand and could find the heart of it blindfolded. Anecdotes? Fables? Stories? Merely obstacles on my mission to dig up the seed of ground-truth planted and hidden deep within the essays of the old men of antiquity.
But with so much practice in my race for information consumption, out of repetition, habit, and training, I have a really hard time not speed reading.
My group, the Lab for Social Machines, is working on a project called the Local Voices Network. It is constituted of a “unique physical-digital network designed to bring under-heard community voices, perspectives and stories to the center of a healthier public dialogue.” In short, we have a lot of audio of people telling stories from their lives. As a part of my research, I’ve been reading the transcripts of these people’s stories. Some are deeply personal, raw, and emotional. Yet, while reading, I’ve found myself flying through them, zooming through the details, feeling little empathy or any emotion at all, only looking at it through an academic lens racing to find the key nuggets of information. And what a disrespect and disservice to those storytellers.
I’ve found now, that when I listen to the audio of those stories, slow down, hear them word for word, hear the emotion in their voice, do I feel some emotional tug.
I believe that is a key problem with media consumption in American democracy today: often, we feel little empathy, no compassion, and no emotion when we read or see stories that should be truly moving.
Of course, how the story is told plays a primary role in the consumer’s interpretation and the emotion they feel. However, I believe the medium is also key.
In order to feel more empathy and compassion when taking in stories, I’ve tried to give more attention to the emotionally stirring mediums. I’ve found them to be longform, often audio or video based, more based in detail, characters and humans, images, key moments, and so on. In these formats, we humanize the people in the story, feel their pain, visualize their circumstances, feel the emotion in the voice of the speaker, and empathize.
In my experience, I have found it to be more rare for text based stories to offer that same punch, both due to my incessant speed reading and the sometimes one-dimensional nature of the text I read (often news, often academic, and often cold).
Getting to the Point…
Shorthand enables text based stories to paces the reader and allows for easy, efficient, but stunning and deeply impactful visual storytelling. The visual storytelling of Shorthand allows artists, data visualizationists(?), storytellers, journalists, scientists, and whoever to collaborate on teams to tell a story that engages the reader. This collaboration enables illustration, photography, video, and data visualization to be enhanced by beautiful and informative language, and enriches traditional text-based stories, pushing them into a second or third dimension of communication.
The slow and intentional spacing of a story segmented not by paragraphs but by the consumer’s scroll rate allow for the writer to place emphasis on a single moment, a single image, a single line of text in a way reminiscent of to oral storytellers when they hit the climax, a moment of suspense, or a key moment of loss.
No longer can you zoom through a moment, zoom through a visualization, take only what you want to from the peice. Rather, the writer has a bit more control over what moments stick out in your mind as important, influential, and meaningful.
I’ve attached examples of stories that use illustration to promote empathy and emotion in stories whos punch can be diluted by news outlets, stories that break down data visualizations into more consumable packages, moments where Shorthand has been used for advocacy, and a visual artist who has incorporated Shorthand into their art to create an array of stunning self portraits.
Finally, Shorthand is incredibly easy to use. I’ve linked one I’ve created about croissants here that took me less than 10 minutes. They offer extensive tips on general storytelling and how to use their tool on their page, The Craft, that is useful for those who use the platform as well as for those who choose not to. The platform is not free (but offers a free 30 day trial if you want to check it out).
Overall, I would highly recommend this tool and other tools and media like it to re-engage emotionally distant or jaded audiences to reinvigorate and bring passion, emotion, compassion, empathy etc. back to what can sometimes feel like a dying or apathetic democracy.