Alex’s Media Diary

Consciously examining my media consumption over the past week has been a revealing exercise. In addition to looking at the breakdown of what media I consume in a week, I wanted to document what form of media I spend the most time on, how I get to it, and what times of day I spend on different platforms.

The simple answer: Gmail, all day.

report by categories


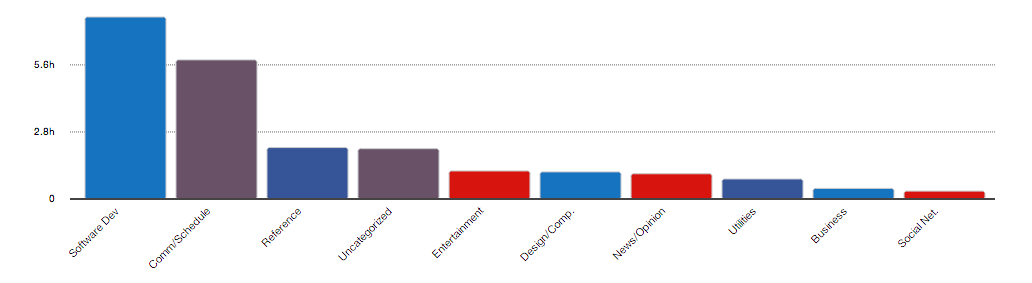
In the las week I spent more than 9 hours on Gmail and scheduling tasks out of the 39 hours I logged on my computer, documented with RescueTime. A close second was writing (time spent on Microsoft Word), followed by social networking sites and news/opinion.

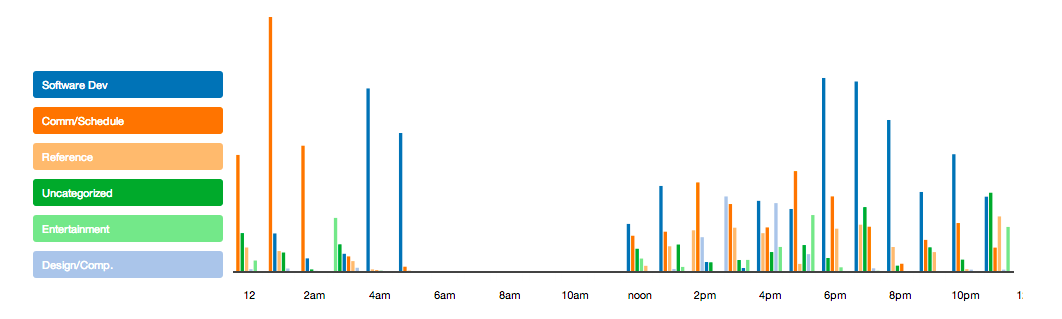
My week looked like this according to RescueTime (w/ hours logged along the vertical axis, day of the week on the horizontal axis, and a key for activity below):

my week - rescuetime


But in reality, my week looked a lot more like this: my daily schedule with activity color coded on top by four categories (red = email, yellow = entertainment, orange = news, pink = social media):

schedule


Combining the data from RescueTime with a notebook log I kept of my media consumption throughout the week, I found that my news consumption tends to happen in the mornings, while I consume more topical/class-related material during the days, and I tend towards entertainment (buzzfeed, netflix) in the evenings.

I had three additional takeaways from this exercise:

1. My media consumption is socially driven

Screen Shot 2014-02-11 at 10.51.41 PM


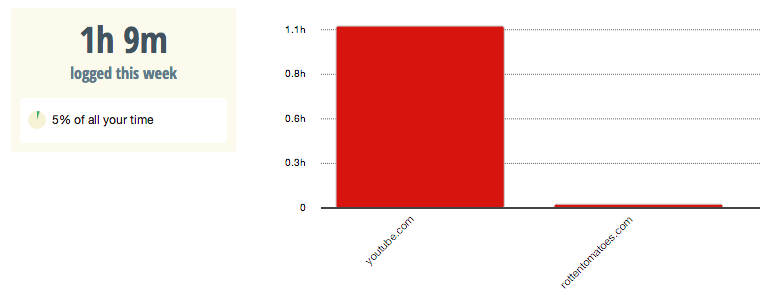
I found that I spent a lot more time browsing Facebook and Twitter than I expected. I’m starting to realize that the reason is largely because I pick and choose to read things that my friends share on social networks. For instance, this story on NPR (Facebook link pictured above) was done by a friend of mine and shared by a lot of my friends in the Beirut journalism network. Via social media I am steered towards consuming the stories written or shared by my friends, many of whom share an interest in the Middle East. Not only do I click on these links, but, after examining the open tabs on my browser at the end of the day, I found that I am more likely to go back and actually read/listen to/consume stories shared on my social networks over other links. This concerns me that I may be stuck in a news echo chamber of sorts, dictated by my online social networks.

2. I am a more engaged media consumer in the mornings

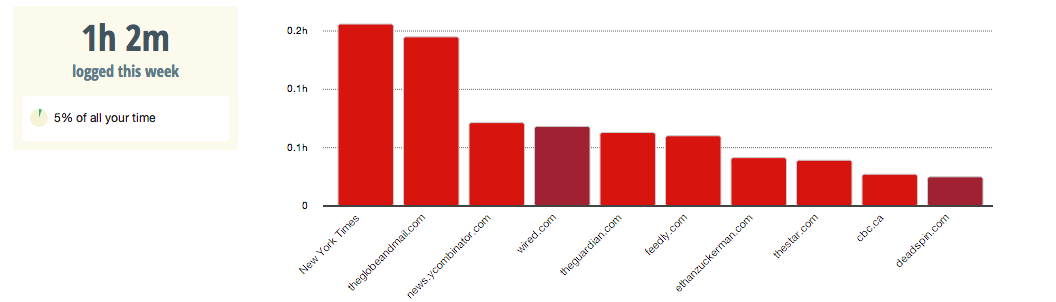
By the end of the day, my browser looks like this:

tab


I am much more likely to fully consume and repost or share a story if I encounter it in the morning. By the end of the day, I’m usually operating at information capacity and I’m less likely to read an article to the end.

3. I consume a lot of offline media

photo


My coursework at Fletcher keeps me reading hard copies. I spent approximately 8 hours on offline texts (I’m including my Kindle in this, but that might be a stretch). This material is predominately made up of books and journal articles related to my research and coursework at Fletcher. I’m not sure if this offline consumption is driven by the environment of being in graduate school, but it certainly cuts into the news consumption time that I spend online and on current events. It’s interesting that while I do consume offline media, very little of that media is news; rather, it is longer magazine or academic articles or books.

Posted in All

Leslie’s Media Diary


What would your life look like if you didn’t have a smartphone? Or an iPad? Would you consume less news? Or just get it in a different way?

This week I tried to answer some of these questions by logging my activities online and offline. I recently stopped using my iPhone (on purpose) and my iPad (not on purpose–it got dropped), and our assignment this week allowed me track how I do—and don’t—consume media in my current low-tech environment. My tools at hand were a MacBook Pro, a Kindle, and good ol’ pencil and paper.

Even before I began, I knew that I was consuming less media that I used to back in the days when I carried an iPhone and a Blackberry at all times and immersed myself in a constant news stream, day and night.

But it really surprised me to quantify exactly how little news I read this week. I hardly consumed any breaking news media–just 114 minutes. I barely wrote any emails, averaging 46 minutes a day on gmail. And I spent only three minutes on Facebook.

Partly, this was due to circumstances—I happened to spent a lot of time travelling and a lot of time trying to write code during this period. Over a five-day period, my activity chart looked something like this. I tracked my hours using RescueTime for computer-based activities and a notebook for everything else, and compiled the results in Excel:

Chart One

My most frequent activities were programming (369 mins), attending class (255 mins), and writing emails (231 mins). In fourth place was reading long-form journalism, which brings me to my next chart: media consumption. I’ve defined media in three categories—books, long-form and news.  This week I spent time reading long-form journalism for my narrative nonfiction class, which was my top category in terms of hours spent:

Chart Two

The news that I read was a bit of a jumble. Here are my top news sites by time spent (for short news stories):

Chart Three

I also tracked what devices I used to consume media, and the result surprised me: I read a lot more on my kindle than on my computer.

Here is the breakdown for what devices I used when reading books, news and long form, by minutes spent. I suspect this would have been pretty different if I was using an iPhone or an iPad:

Chart Four

By comparison when I did the same breakdown for my activities overall, my computer was dominant, accounting for 81% of my time logged. It seems like life without a smartphone has me spending more time on my kindle, and more time reading long-form journalism instead of news stories.

So is it worth living without an iPhone or an iPad? For the time being, absolutely.


Posted in All

Hiromi’s Media Diary

I consume medias mainly on PC, Kindle,Mobile phone,TV,printed media and organic relation (oral:talking with people, physical:dance workshop). I used “Rescue Time” for my PC, and as for other medias, I took notes and summed them up.

While setting up my PC for Rescue Time, I encountered something very surprising.

On Rescue Time, you categorize your activity on PC either as “distractive” or as  “productive”. Checking news is part of my work life for more than 20 years. So I categorized “News & Opinion” as “productive”. There came an alert “Most people categorize this as “distracting time”.

WHAAAAAT!! When I was on shift as a page editor, I had to read all 5 national newspapers from top to end  for 3 hours in early morning before go to work. And you call it “distracting time”!  (Of course you can persist and set it up as “productive” in Rescue Time)

OK! Calm down. Here is a very important key for news industry. People want to be productive. But most people think reading news or opinion as distracitve, because it’s passive, I guess. If we can let people consume news in productive way, there could be a break through for the future.

Let’s go back to homework. Here is the summary of the time I spent for the different media.(numbers are minutes I spent)

graph01のコピー

I spent702 min. for mail. Half of them are for the report and message sent back to Japan, so that is for business. “Oral” does not include chatting at the lunch, but group meeting.”Physical” refers to dance lesson and dance workshop.

As I have been working in the media industry, I tend to use both old and new media. If I put them on timeline, you can see different aspect.

partmedia

I use mobile phone as an alarm clock. So I sleep with mobile and Kindle. Whenever I wake up at night, I check my mobile for news. When earthquake happen while I am sleeping , I usually wake up at the primary wave and check the data and news on mobile. If it is bigger than M5, I turn on TV and PC.Thus the first screen I see in the morning is mobile.

Then I check TV news. First CNN, surfing through big networks then lands on CNN again.

During daytime, I use mainly PC, but also mobile when I am on move.The evening time is for printed media and Kindle. The last screen I see is mobile again.

This pattern is created after a long time of experience. If anything big happens, I have to go to the newsroom, I have to make phone calls.

How do I choose the media I consume?

graph02のコピー

I spent 140 minutes, which is almost a quarter of time I spent for media, at the media introduced through social media. They are mainly technology and business information.

There are several news sites and data site which I constantly check. It is like police car checking several points on patrol. There I check top stories and then shop around. It is like “Things to do ” list.  This patter must be quite different from young people, but having several media which I need to check for work, I cannot help.

Posted in All

Primavera’s Media Diary


For a more detailed overview of my media consumption, click here !media-consume

After trying to figure out which tool I could use to track my media consumption, I immediately encountered a problem: I have 3 different computers that I use regularly depending on my location (my old computer which always stays home, my new computer which resides at the Berkman center, and my netbook which always follows me along), 2 phones which I often use to check my emails or skype, and I sometimes rely on analog media, just as books. I could therefore not figure out a single application that would collect data about my media consumption simultaneously on all devices.. so I decided to keep track of it myself. Here is the spreadsheet that came out of it.
In addition to measuring my media consumption, my curiosity brought me to also collect the main topics of consumption. I tried to classify every piece of information that I gathered from media into broad categories, so as to be able to subsequently assess the correlation existing between the media I consume and the type of content or information I get exposed to.
After fiddling with various tools for datavisualisation, I ended up picking up d3.js – a very powerful tool for creativing beautiful data visualisations in (almost) no time – at least once you’ve figured out how to use it.. The current visualisations are not that exciting, of course, but that’s all I managed to get done for this first attempt at learning the tool.
The result was quite surprising as I realised that my media consumption during the week was limited to a very small number of very specific topics, which are not in fact at all representative of how I perceived my interested to be:

  • Art was the great winner, with over 26 hours over the whole week. Of course, this was greatly related to the fact that I spent most of my week working with colleagues on our Burning Man proposal whose deadline is next week, so a large part of my “Conversations” this week were related to “Art”.
  • Programming was (surprisingly) the second, with over 10 hours of exposure. This is, in reality, not so surprising, considering that I was actually learning how to use d3 for this very assignment, so I had to spend many hours browsing the web in order to figure out how to achieve my goals.
  • Science-Fiction was third, also over 10 hours of exposure. I did not expect it at all, since I’m actually not a Science fiction freak, but then again I am currently reading a science fiction book and I’ve been watching various Sci-Fi movies that week, so it probably makes sense.
  • The rest basically amounts to my research topics: surveillance, antitrust, bitcoin, copyright, privacy and mesh networking, which when summed together amount to over 40 hours of exposure during the whole week. A result that did not surprise me at all.

The other interesting result of this analysis was derived the relative proportion of media I have been consuming over the week. Web is naturally the number one (with over 36 hours of consumption), which is not surprising since most of the information I seek comes from the web – although I did in fact expect my weekly exposure to the Web to be even higher than 36 hours. But what was highly surprising to me was to realize that the “Web” medium was so closely followed by “Conversation” (with over 33 hours of exposure). Of course, one might argue that “conversation” is not a medium in itself.. yet, as I compiled the spreadsheet, I carefully marked down only these conversation that were actually exposing me to new information, or that involved some kind of collaborative information construction.
This made me reflect upon the actual definition of “media”. I personally never really thought about what is or is not a medium, in fact, I consider myself to be extremely ignorant as regards media. So this is probably not the proper definition of “media”, but according to my personal view, “media” is whatever convey information or allow someone to communicate – which is why I decided to include “conversations” whithin the media category.
Overall, I think this was an extremely interesting exercise, which allowed me to become more aware, and to pay more attention to my media consumption. While I think the weekly “topics” were slightly biased or contaminated by circumstancial factors, I was happy to discover that “conversations” play such an important role in my media consumption. Since I arrived in Boston 3 months ago, I have found myself complaining about how difficult it is to get any work done in such a mentally stimulating environment such as the Berkman Center and the MIT Medialab. Now, I can finally justify it on being one of my main sources of information ;).
I also really enjoyed the process of figuring out how to transform a basic spreadsheet into something meaningful and visually enticing – which allowed me to discover the potential of d3 as a datavisualisaton tool, and to come back to my somewhat rusty programming skills.


Posted in All

Julia’s Media Diary: An American Affair

As a journalist, I was interested in learning about the kinds of news media I generally consume: where it’s from, the sources I tend to go to, whether information is pushed to me (via social media or e-newsletters) or I actively seek it out. I used RescueTime and a media log to figure out how and where I was getting my news.

An American Affair

I was surprised to learn that almost all of my top news media sources were American. In fact, US-based news sources far outstripped my media from any other country, with Canada and the UK trailing behind. Mainstream media sources—NPR, the New Yorker, the New York Times—represented the bulk of my media diet. I also spent a lot of time reading about the changes in the media industry these past few days. (General news stories were the main focus, followed by science-related stories, and then media-related stories.)

top_news_sources

Push vs. Pull

As well, I found that I spent almost as much time wading through news information that is pushed to me as I do seeking out news.

push_v_pull

The Sadness of Endless Scroll

When it comes to news media, I mostly gathered information online (using my computer and my iPhone), though I also got a healthy portion of news through the radio or podcasts. What didn’t make it on to my graph was the vast number of websites I had visited for only minutes or even seconds, according to RescueTime. Of my top news sources, Twitter and Feedly represented a large proportion of the time I spent consuming media, which suggests I was scrolling through stories and reading tweets and snippets of stories instead of diving deep.

top_news_sources-type

The Tyranny of Gmail

Finally, I was distressed by the amount of time I dedicated to Gmail. Nearly seven hours in five days, and two of those days fell on a weekend when I tend to use email less than during weekdays.top_media_activites

Reading books—for classes and pleasure—was my third most popular media activity, after creating content on Microsoft word. This was somewhat comforting, though I am not sure it represents my typical media diet. Since I’m on leave from work at the moment and back at school, my sources of news and the way I use them differ quite a bit from the usual. Still, I would like to offer these media diet resolutions:

1) Cut the Gmail habit.
2) Dedicate more time to reading alternative news sources.
3) Seek out news sources from countries other than the US, UK, and Canada.
4) Spend less time with information that is pushed at me on the endless social media scroll and more time lingering on stories I seek out.

Reflections On A Weeklong Media Diary

Summary:
While this class approaches media consumption with an open mind, I hold personal opinions about what kind of media I should and should not be consuming in order to achieve my goals. Embarking on the Media Diary for a week allowed me to compare my perceptions of and aspirations for my media consumption with reality. I learned that my gmail consumption far exceeded the time I spent on social media, entertainment, news, and other categories. A focus on effective time management must therefore mean a focus on my gmail use.air max sale

My perceptions:

  • I spend too much time on social media sites like Facebook and Linkedin.

  • I spend too much time on entertainment sites.

  • I don’t spend enough time focusing on my priorities (“urgent” v. “important”).

My aspirations:

  • Improve my time management skills to focus more of my media time on my top priority projects.

  • Spend less time on media I consider “distracting” like social networks.

Media Diary Goal:

  • Understand my media consumption by type and value added, particularly time spent on social media and entertainment sites.

Methodology:

1. Quantitative data: Use RescueTime to analyze browser use.

2: Qualitative data: Based on quantitative results, reflect on value added and how that value correlates with my time management goals.

Results:

  • Quantitative data: the RescueTime data showed me that I spend 50% of my online time on gmail communication, another 25% on composition (primarily schoolwork), only 7% on social media, and 18% spread across other categories.Screen Shot 2014-02-11 at 10.10.43 PM

  • Qualitative data: Looking at the RescueTime data shows me that if I am to increase my allocation to meaningful media consumption, it should be more effective management of my gmail use. This data was not parsed apart into “productive” and “unproductive” gmail time, so this is a next step for me moving forward.

  • Neither entertainment nor news media were significant components of my time over the last week original new balance
    .

Discussion:

Maintaining this media diary was illuminating for me because my preconceived notion was that the time I am spending on social media and entertainment is preventing me from being productive. In fact, since half my media time is spent on gmail, I need to make sure that I am achieving my time management goals within my gmail use. A next step for me is building more effective email habits, such as the “4 Ds” strategy of Do, Delete, Delegate, or Defer. Correlating my gmail use with my time management goals will move me in the right direction towards understanding the value add of the majority of the time I spend on media cheap air jordan.

William’s Media Diary


This was an interesting and challenging assignment. Defining what to include as media consumption, figuring out how to measure it, and summarizing the mass of data in a reasonable form were some of the design decisions I had to make. I decided to provide qualitative observations on my offline and mobile access and then try to “deep dive” into my web history to gain further insights into what I consume.


Offline Media


  1. Print: I don’t currently subscribe to any newspapers or magazines. I picked up and skimmed the MIT student newspaper (the Tech) and the newsletter of the graduate dorm I live in (Sidney Pacific). The elevators of Sidney Pacific have a wide array of posters that I inevitably see every day. A common characteristic of the print media I consume is that they are simply there.

Elevator posters on February 8.

  1. Television: I watched the Olympic opening ceremonies on Friday, February 7 for two to three hours. I also turned on the television at a few points this week, out of habit. Usually, I channel surf or leave the television on as background noise. Possibly because of the way that television is architected — it’s really easy to press the channel-up or channel-down button — I probably get a wider variety and range of perspectives than I do when I’m on the Internet. For example, this week, I’ve watched at least of a few minutes of PBS, the three major American networks, the Discovery Channel, Fox News, and C-SPAN.


  1. Radio/Music: I didn’t listen to the radio this week. I usually listen to NPR if I drive, but I didn’t drive this week. I used Songza (a website like Pandora that gives personalized music recommendations) to listen to music on my phone and computer.


Mobile

A substantial amount of my media consumption is on my phone. Unfortunately, I didn’t find a good tool to automatically track my mobile usage or automatically take screenshots; in hindsight, capturing my browsing history might have worked to some extent, but it wouldn’t have been able to capture all of my usage through various apps. It’s my hope that my deep dive into my desktop Internet usage will capture some of these patterns.


A key exception is Facebook. A few weeks ago, to reduce distractions on my computer, I decided to logout of Facebook from my computer and access it only on my phone. I think that it has been a successful experiment — I’ve only logged in to Facebook on a couple of occasions. On my phone, I accessed Facebook on a daily basis and generally click on a few links on my news feed.


Desktop/Internet

RescueTime

As a first step, I used RescueTime to measure my computer activity. As illustrated below, it provided an indication of when I’m on the computer and the types of activities I do. It seems like a lot of my most productive hours are in the early evenings and early hours of the morning.

Usage by hour of day

Usage by category


RescueTime also provided a breakdown of my news and entertainment consumption:

News consumption

Entertainment consumption

Reflections


  1. I’m pretty surprised by how much I read Canadian media — I usually go to these URLs as a distraction.

  2. In contrast, I “stumble upon” other kinds of physical offline media more often.

  3. It’s interesting to think about how to think about and capture offline interactions and media consumption. The ways that I can think of, such as written or audio journaling or taking photos regularly, seem fairly disruptive and invasive.

  4. It takes time and effort to trace one’s own media consumption. Notably, large Internet companies — Google, Facebook, Amazon, Twitter, and others — have substantial infrastructure and resources capturing every click and action of their users. It is interesting to think about what insights can be gleaned from that data, along with the limitations of what they can infer about human behavior and preferences.

Dalia’s Media Diary

For my data collection, I decided to use the application Rescue Time. Rescue Time is ideally used to enhance productivity and manage the amount of time spent on ‘disruptive’ sites. The user can indicate a set of productivity goals with a set of sites that would be considered disruptive and calculate productivity on a daily basis based on media consumption.

 I, on the other hand decided not to set any goals and just record my consumption based on sites visited. I do have to note that I have reservations regarding the pre-defined categories in the application, especially when Twitter and Facebook are considered disruptive sites. I find this problematic, not only because I use both platforms to conduct research, but also because I find that both sites can be valuable sources of information and news. Let alone the fact that other forms of media, such as daily interactions and talks are obviously not recorded and thus not represented in this data set. My other reservation is the fact that I can pause the application and stop recording any media I consume. I have to admit I used it on multiple occasions, which gives a skewed result of how many hours I was online and the media I consumed. Regardless, I found quite interesting results and patterns in the data set which I present below.

When I first thought of doing this assignment, I thought of creating a time lapse video of the sites I consumed using the data I collected from Rescue Time. Unfortunately, I face a number of hurdles, one being that the data collected was difficult to translate into a video. More importantly my search for a tool that would be able to create this time lapse proved futile. I tested out Popcorn Maker, (I recalled someone once explaining how easy it was to use, but also the ability to add comments to the videos) However, when I signed up and started using it I realized that I can only create a video from already published media on the web. Not wanting to duplicate some steps and publish material online to then use for a video, I decided to use iMovie, which I surprisingly had never used (Final Cut Pro was my program of choice.) As I started to compile images and graphs onto the program, only to realize that I couldn’t truly translate what I wanted to do with the data using this program.

I eventually, and for the sake of time decided to stick with an info-graph which you can find HERE. I used the site infogr.am to create this graph, it is one of the many tools that are available on the web that can create info-graphics from raw data.

In addition to the info-graph I created, I decided to look into and present my daily consumption which varied from day to day, especially on the weekends.

Day 1 – Wednesday, not a complete report since I started Rescue Time in the afternoon.

Wednesday

Day 2: Thursday

Thursday

Day 3: Friday

Friday

Day 4: Saturday

Saturday

Day 5: Sunday

Sunday

Day 6: Monday

Monday

Day 7: Tuesday

Tuesday

What became a noticeable media pattern is that I was consuming more social media in the early morning and late night during the day. Whereas during the day I spent most of my time on e-mail, scheduling and ‘learning’ sites.

Over the weekend I noticed that I had more time to catch up on the news. I have to admit as someone who considers themselves a news junkie, the fact that I spent so little time reading the news was shocking. Although, my news reading behavior has changed in recent years and I’ve started to rely more on social media as new source.

Having noted all those observations, I would still place a disclaimer and indicate that the data collected by Rescue Time is not entirely accurate and does not indicate time spent at talks, watching a film or media consumed on my phone.