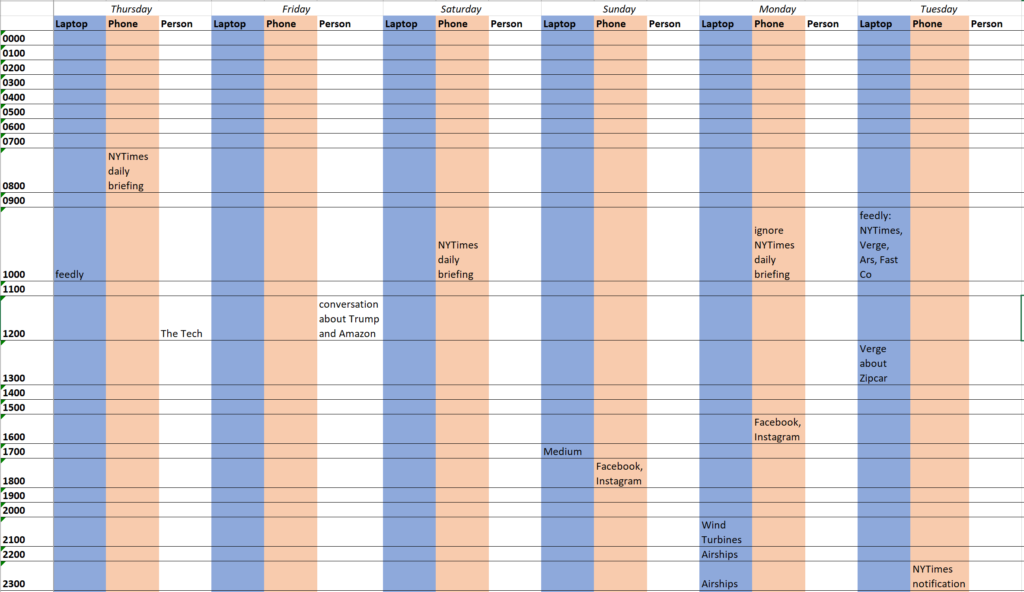
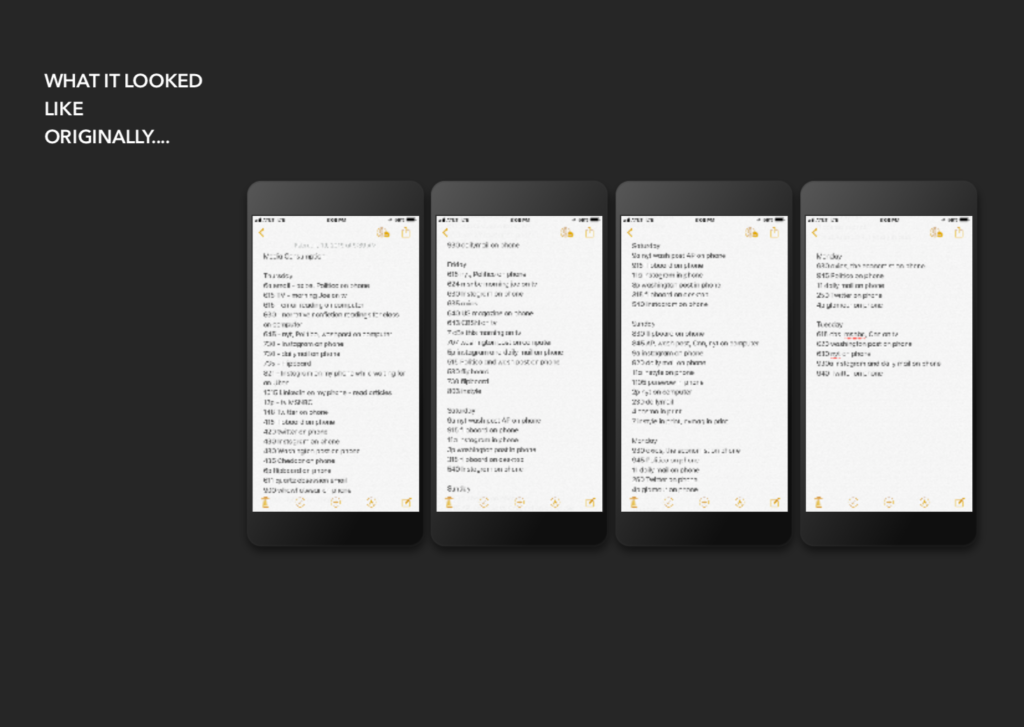
Timetable summary of my media intake organized by method: laptop, phone, or in person
I kept track of my media consumption on Google Keep for the past week and summarized it with a timetable. This past week, I’ve mostly been working on a research project, so I didn’t spend much time reading articles – my primary method of staying up to date. My time outside of class, homework, and human interaction was primarily reading MATLAB and Python documentation. I was mostly surprised that most of my world news comes from NYTimes’ daily briefing. It had me thinking about the trade off between being able to get my attention with phone notifications versus the information bandwidth, which enables deep dives, limited by screen size.
While exploring ways to log my media intake, I played with a few ideas of visual representation. Perhaps collection of photographs of every piece of media I consumed, or short, 1 second videos. Quickly overwhelmed by the vast amount of media consumed, with 30 new videos and photos over the course of just a few hours, I decided too comprehensive a log would prove unmanageable and unsustainable for the week. In an effort to simplify, I began exploring the idea of graphically portraying that intake. While beginning some graph development, I checked my second most used app behind gmail, Google Calendar.
What a simple design. What clean colors. What a nice way to map how I distribute my time.
And so I began to log my media intake on the calendar. Again, the media log quickly overcame me and my calendar began to flood and overwhelm, so I decided to stick with the structure but move away from the platform. And voila, a visualization was born!
I intended to show one orientation of the image to be portrait and the visualization to scroll and allow the user to hover over each block. I used Adobe XD and was struggling to get the sample video to upload to WordPress. In the meantime, I’ve shown the still shots with the image in landscape.
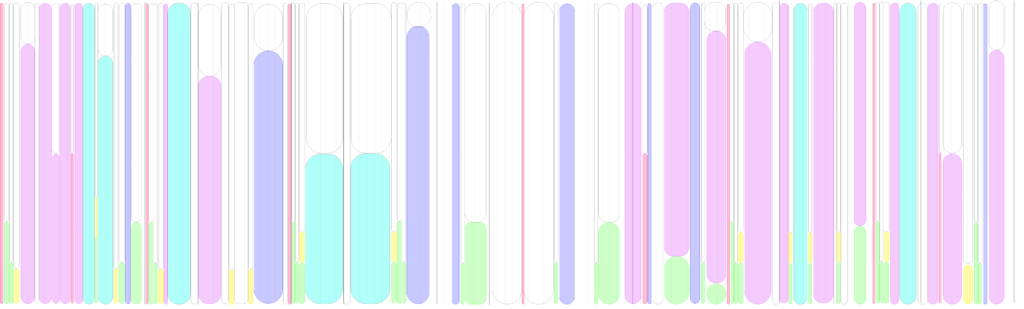
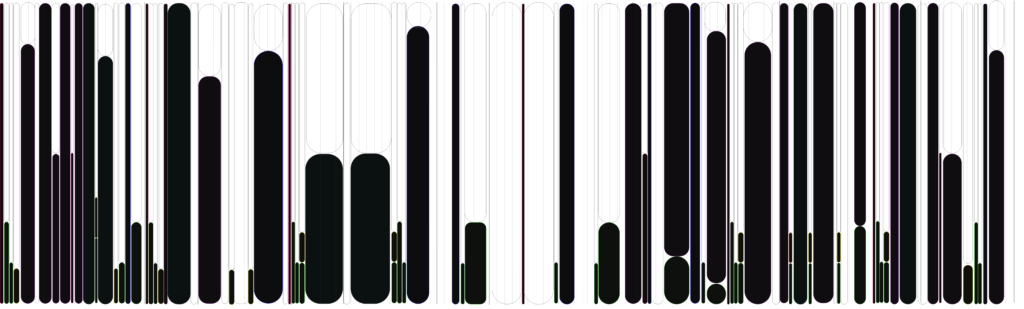
The x axis is time, the y axis my attention. For each section, my attention is distributed between 1. people and human interaction (white) 2. Spotify, music, and podcasts (green) 3. ads (yellow) 4. entertainment, such as a Cherry Glazer concert or Brooklyn Nine-Nine (blue/purple) 5. class lectures, videos, and workshops (teal) 6. Instagram and Reddit (red) 7. work media such as readings for courses, research, and media content I produce (pink). For many chunks of time, my attention is split between people and media, or Spotify and readings.
Blacked out to see the contrast in media versus non media attention, overall you can see about 50% of my time is devoted to media intake, be it the only thing holding my attention or just music running in the background. A dip in media consumption over the weekend in the middle of the graph comes from a visit to a friend’s family in Western Mass. During that time, spent little to no time consuming media until, only chatting, playing games, and watching a little brother’s basketball tournament until the All Star game that night. I included an all day workshop on Saturday, the two teal half tall chunks, where we needed to both read and consume content produced by community organizers, but also engage with people consistently throughout the day.
WorkFun
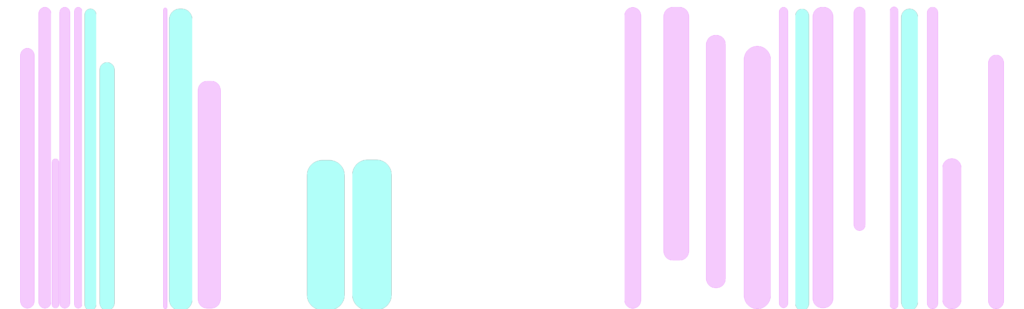
Finally, I separated out work from fun. Instagram, Reddit, Spotify, Podcasts, and some news fell into my entertainment or fun graph, the second of this set. While the blue shows concerts and tv shows and is somewhat irregular, taking up almost all of my attention at one time for an extended period of time somewhat irregularly, the green of music and podcasts and the red of instagram and reddit were regular and somewhat constant throughout my week, but took up much less attention space. I get my news sometimes through podcasts, but often spend little time diving into it.
Something that was difficult to track was non-work article consumption. I read news articles and watch videos, but for quite short periods of time regularly and often. I am not a news junky, but get updates from the NYT, WaPo, WSJ, and a few other news outlets. While some articles I will read, I rarely anymore spend extended time on the sites themselves or sifting through stories.
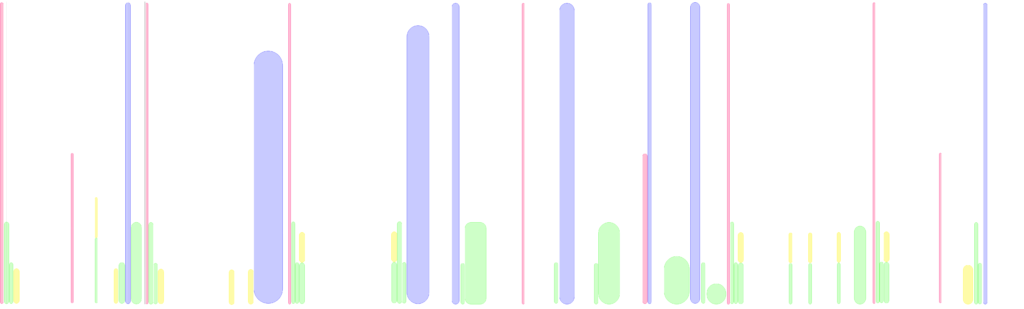
Work was much more difficult to separate out. In classes and research, I read many stories and news stories for work and research, but that have an entertaining quality to them. It was a much more difficult to make labels for the work, and different media started clumping together to form just two groups: out of class work and in class work.
A few takeaways: I listen to podcasts or music frequently throughout the day as background or while doing other work. I have worried I spent too much time on social media apps and entertainment and have put an effort to calm it down, but see the cycle of low work, high work that naturally occurs throughout the week and weekend and find it healthier than I anticipated. I am a bit surprised about how little news I consume. Because the articles I read in work are old but politically minded, it often feels as if I am in touch with what is going on in the world currently. Many of the meme accounts, instagram accounts, and subreddits I follow are feminist, socialist, political, etc. and touch on a lot of news. But I do not go on NYT or WaPo like I used to. I believe it is pretty intentional, but I wonder if it is helpful or constructive to the public sphere.
I tracked my media use from 2/14 – 2/19 using a combination of RescueTime and a notebook to log non-screen media consumption. Reflecting on my week and taking a look at the data I collected, a couple of things surprised me.
I don’t consume a lot of traditional media. I watch almost no TV (don’t have one) and don’t have a login to watch internet cable (the last live TV I watched was the Super Bowl.) I don’t get the paper delivered, nor do I subscribe to mailed magazines. I do have a Netflix account, but watch sporadically (I watched one movie for ~2 hours in the week I logged).
I am extremely reliant on the New York Times for news. I read (or scroll though) the “Home” section of the mobile app most days, and I often listen to “The Daily” podcast. One interesting behavior I noticed is that if I do come across news on social media or the internet, I look to validate it in the NYT app.
I increasingly want someone to tell me how to interpret the news. I’m starting to want to know both the news and what experts think about it. The Daily is great for this, but I also listen to Pod Save America / the People sometimes and Bill Simmons for sports.
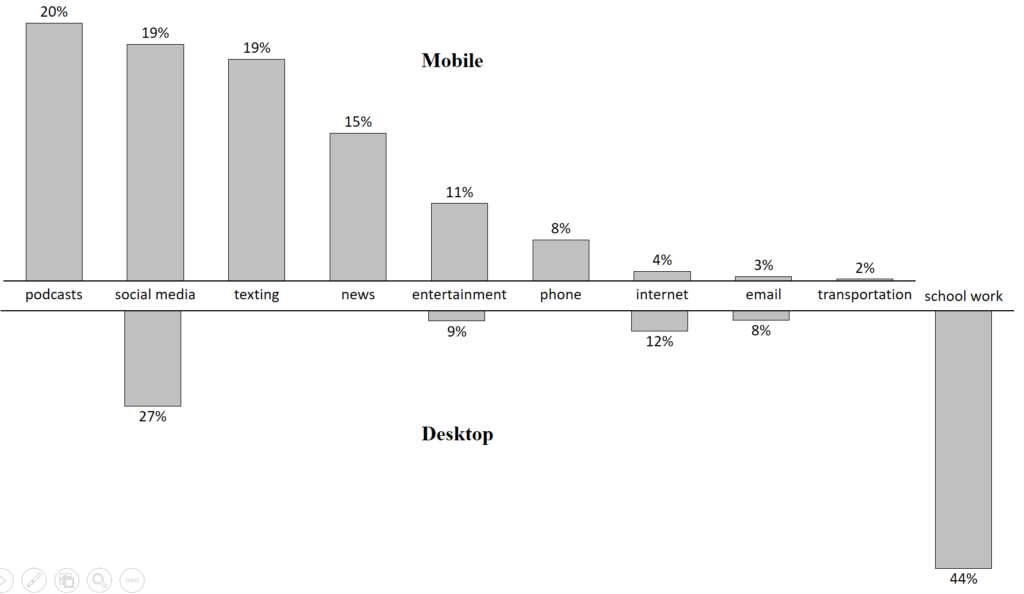
Taking a closer look at the data, it’s clear I consume more media on my phone than my computer (though I wanted to show a percentage basis here, the absolute numbers aren’t so stark). I tend to use my phone for social and non-work uses while I use my computer for schoolwork and professional tasks.
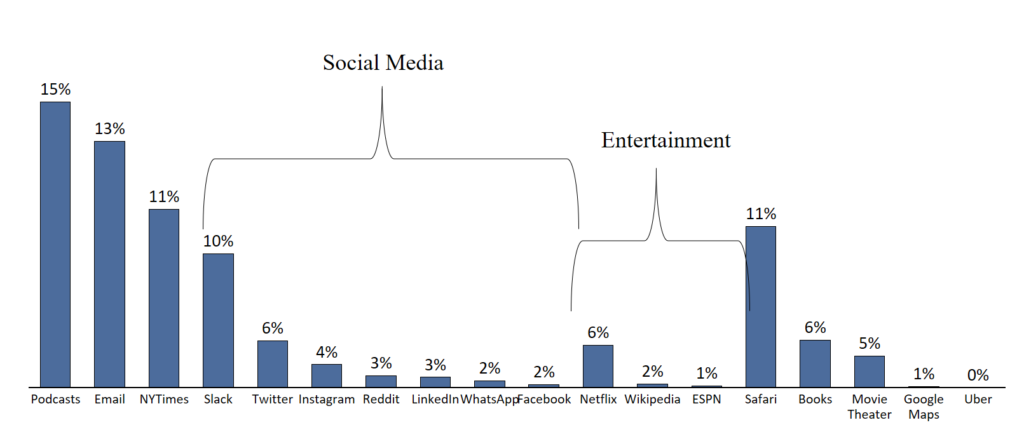
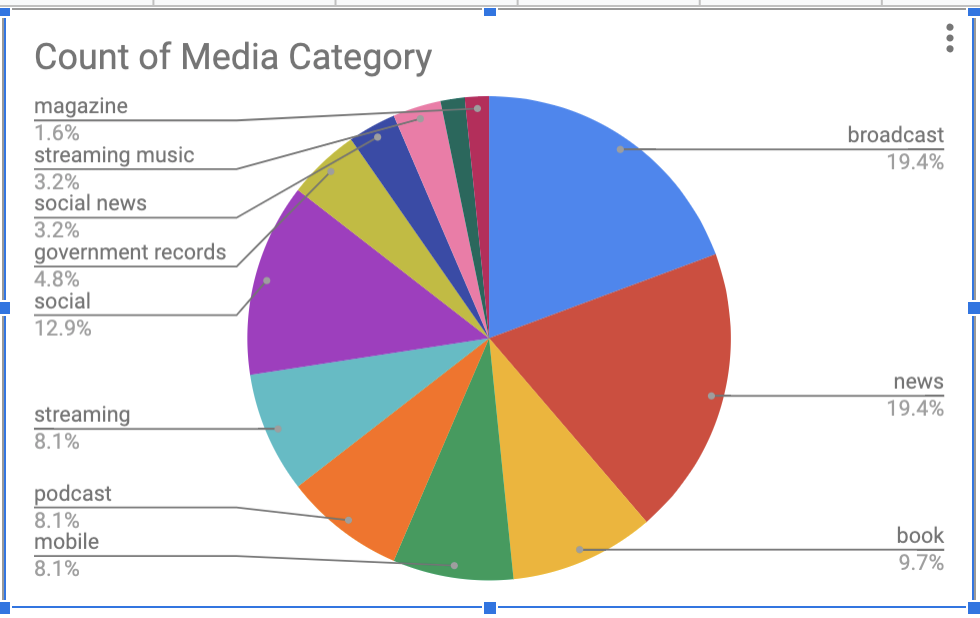
Looking at specific apps, I’m getting a lot of my media on social media, and, as mentioned above, almost all of my news from the New York Times. Also a little bit strikingly, I spend very little time reading for pleasure (aside from news), as shown by the only 6% of time with books. One detail with this chart is the podcast number is inflated because I often listen to podcasts while I multitask on my phone.
In closing, a few takeaways for me based on the exercise:
I should probably diversify my news sources. Nothing against NYT, but I think I would be in some ways be more informed if I read other outlets and compared the different ways the news is framed.
I like audio a lot. I am starting to read less and listen more, especially with respect to long form journalism. Podcasts like Caliphate or The Dropout are starting to replace my reading of the New Yorker or the Atlantic.
I was curious to what extent I would be able to cut out TV shows when I got rid of my TV, and I think I’ve been pretty successful. I don’t miss it.
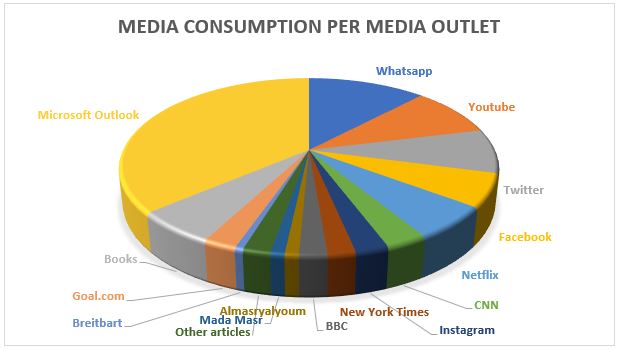
For me, this exercise was a wake-up call. I’ve always thought that I was a moderate consumer of media, and that is why realizing that I spent around 8 hours per day consuming media this week was a revelation. The diagram below shows my consumption per media outlet. I spent a significant portion of my time (3 hours per day) using Microsoft Outlook, which is the application I use for work. This diagram made me realize the amount of time I spend sending and receiving emails. I also noted the number of times (12 times per day) I used the Outlook app on my phone to check if I have received any new email. Social Media is another outlet that takes a significant portion of my time. This observation can be attributed to the fact that most of my family and friends live abroad, so social media offers me the best method to connect with them and know their news. The other observation I noted was that I only spent 10 minutes per day on articles that I’ve opened through Facebook and Twitter. I honestly excepted this number to be higher.
Consumption per media outlet per day
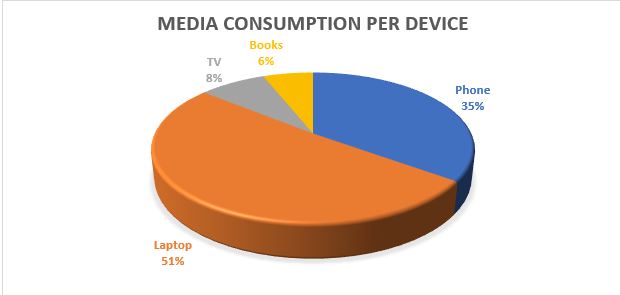
I was also surprised to realize that 51% of my media consumption was done through my laptop. I think it might be because during my work day I sometimes take some mental breaks by reading some news and entertainment articles. I also sometimes use my laptop for viewing videos which might have attributed to my consumption pattern.
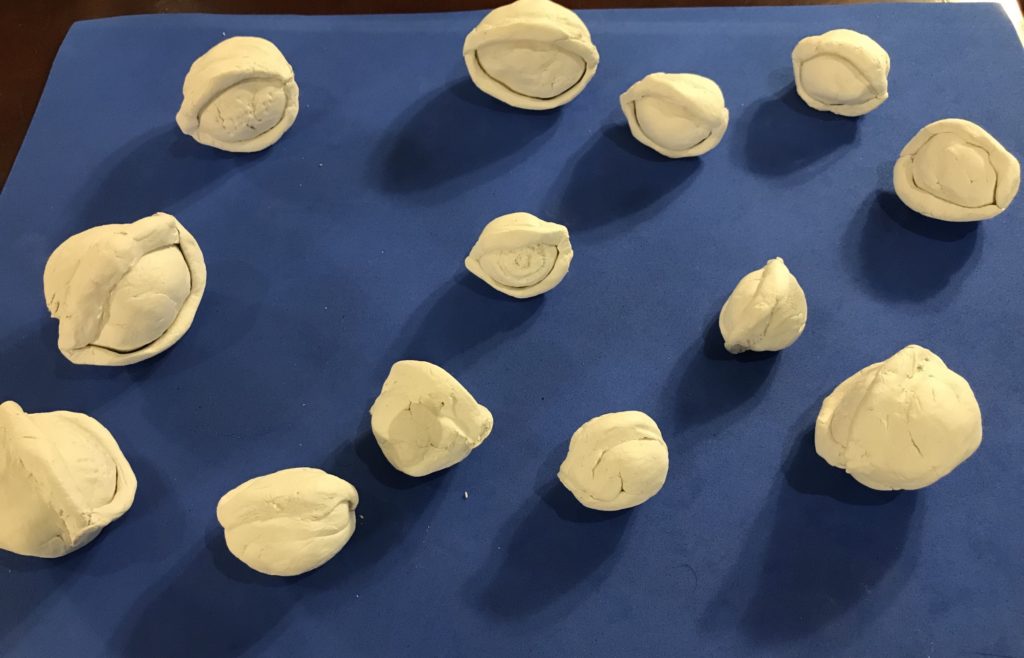
Another revelation for me was the significant number of mediums I consumed that are being tracked third-party data-tracking applications. By using “Ghostery” a web extension which allowed me to monitor and block these applications, I realized that third parties are tracking 45% of the media I consume. I have created the sculpture below to express my feelings regarding being continuously tracked by third party providers and by the media outlets I consume online. In the middle, there is the eye of the user being monitored by different digital eyes (representing the tracking of information) that are surrounding the user from everywhere, designed to make the user feel that the experience is as natural as possible so that the trackers can continue to mine data.
Overall, this exercise was eye-opening for me, and it allowed me to notice specific patterns in my consumption that I did not expect. It also prompted me to reconsider the way I consume media.
Overall this felt like a week of frustrated habits as I adjusted to term; in each of the four discovery mechanisms for textual media I use (social media, directly visiting websites like some kind of primate, email, RSS), I kept opening something automatically before realizing that I had urgent homework, research, organizing, partying, or fevering to attend to. Starting, however, from the means of discovery:
Here is my diary, the second tab has some rudimentary analysis — there are deeper, more interesting ways to go at this I’m sure. This was a fun exercise, and I found a bunch of different ways to gather data on my media consumption. My iPhone’s weekly report showed me how many alerts I get per day (65!!), Google tracked my YouTube TV watching (daily Jeopardy habit). But most of all I realize that very few minutes go by in a day without me consuming some type of media: podcasts, music, books, etc… I’m constantly plugged in.
From Wednesday, February 15th, to Monday, February 21st, I kept track of my media usage and consumption, including app usage on my phone, laptop, and smartwatch, total time on different apps, and time spent reading or listening to news. I recorded the majority of my usage manually (to the best of my ability) while also using RescueTime to track the activity on my computer. I created the charts below using info.gram.
Below are various charts showing my usage as well as my takeaways from the entire experience:
Technology Usage
I broke down the various methods I consumed media by tracking my activities on each platform. I also kept track of my sleep to show the stark contrast each day between watching television and resting.
Additionally, here is the day-by-day chart of my technology use:
Analysis
By looking at both charts it’s clear that my time is largely taken up by staring at either my MacBook or my iPhone. This is largely due to my app consumption, especially Netflix (for my laptop) and Twitter (on my phone). I was somewhat surprised by my Apple Watch usage, partially because I thought I looked at it fewer than I do; I averaged 75 glances at my watch each day.
Application Usage
My media consumption is largely done through an app on either my laptop, phone, or smartwatch. Though I currently have 151 apps installed on my iPhone, I only used these 11 apps for a statistically significant amount of time over the six days:
Netflix
Spotify
Outlook
Twitter
Podcast
Slack
Instagram
Microsoft Word
Facebook
WhatsApp
Text
Here is my total app usage over the past six days:
Additionally, here is the total number of hours spent on each app:
Analysis
I do wonder how much my app usage depends on my schedule each day. For those where I’m in class more, I seem to rely far more on Outlook and Twitter. But when I’m home, Netflix is the dominant app by far and away. I wish I could’ve seen a snapshot of my usage only a year ago. I know my Twitter usage would’ve been much higher, as I’ve noticed a drop off over the last several months in the time I spend on Twitter each day. This may be due to my exhaustion of political news or simply a move away from checking Twitter compulsively throughout the day for news. Also, I’ve started using Slack more now that I’ve joined a startup team, and we use it as our main means of communication.
Reading Habits
Finally, I wanted to see how much of my day I dedicated to consuming news, and more importantly, how I choose to do so. I know my use of Twitter has decreased over the last several months, but I wasn’t sure if I had dropped from one of my most used apps.
A large portion of my news consumption comes from podcasts, including:
This American Life
Reply All
What What Don’t Tell Me
The New York Times’ The Daily
NPR Poltiics Podcast
Here is a the breakdown by day of the total number of hours spent on each app each day:
Analysis
The biggest surprise for me came out of my little use of Facebook. I always assumed it would be one of my most used apps, but I rarely check the app unless I have an event or a friend request. I also included my time on Messenger because it was such a small portion of my overall time on the app.
Takeaways
Maybe the biggest thing to take away from this exercise is how little I sleep or do anything without a screen in front of my face in some way. I’m always inundated by media in some fashion, and the majority of it is something I do without even thinking, such as listening to music or checking my email on my watch or phone.
When I finished my analysis, I realized that I only spent approximately 13 hours in the total 144 hours of the six-day period doing non-technology activities, such as talking with people. It made me realize that it may be time to schedule some sort of technology break for a few days, if only to refresh my mind and remind myself that things are going on around me and not just on a screen.
The timing of this assignment was a little fortuitous, because the past few months have forced me to reflect on exactly what I read, when, and why. During the 2016 election I became a true Twitter junkie (the communication proclivities of one of the candidates didn’t help) and seldom made it away from the platform towards longer-form content or into a slower-paced environment.