I tried my hand at creating audio for the Digital Toolkit assignment. I took a look at different technologies used to detect DeepFakes and other kinds of manipulated media. Enjoy!
Show notes:

I tried my hand at creating audio for the Digital Toolkit assignment. I took a look at different technologies used to detect DeepFakes and other kinds of manipulated media. Enjoy!
Show notes:
 The meteoric rise of the field of Artificial Intelligence (AI) has had a
remarkable influence on various aspects of our lives, and this influence is
only expected to rise. AI has already disrupted the field of journalism with
the introduction of “Algorithmic journalism” (Dorr,2015). Algorithmic
journalism involves a “software that automatically produces texts in
natural language from structured data.” Various economic reasons are
driving the rise of AI within journalism. First, AI spares journalists the time
to draft articles and news pieces that are relatively uniform such as daily
news reports about the performance of the stock market. AI’s use in editorial
tech helps writers and journalists review their pieces promptly. There’s also
an argument that AI may help reduce the biases in certain stories, but given
that the algorithms drafting the content may itself include the biases of the
person who coded them, this argument still has its flaws.
In its bid to enhance its ability to reap the fruits of AI in journalism,
Reuters has introduced an AI tool called Lynx Insight (Kobie, 2018). This tool
aims to augment journalists and writers rather than replace them by providing
them with analytical tools that synthesize big data in a way that nurtures
their journalistic role. Lynx Insight will analyze a vast amount of data to
identify any interesting patterns or topics that can allow Reuters the
opportunity to publish content that is innovative and pioneering, and at the
same time fits with the readers’ interests. Lynx Insight aggregates the data
and sends the journalist a message with a brief about any interesting patterns
with some background about the story or topic. The App associated with the tool
provides journalists with a live feed of updates regarding any possible
breaking news stories.
AI’s growing influence in the field of journalism may have significant
implications on the future of news and media. AI may help journalists
personalize the news according to the interests of their audience, which may
enhance the appeal of the news and its readability. Its ability to reduce the
cost may allow new news and media outlets to enter the field which supports the
democratization of the field and may provide a competition that can support the
quality of the content. Unfortunately, this competition may also lead to the
deterioration of the content with news outlets fixated on competition and
monetizing content rather than nurturing the field and improving its appeal.
Over-dependence on AI tools such as Lynx Insight may reduce the journalist’s
sense of agency and innovation ability. This dependence may be destructive to
the field of journalism if there are issues with the algorithm, or if the data
used by AI has significant flaws.
Kobie, N. (2018, March 10). Reuters is taking a big gamble on AI-supported
journalism. Retrieved February 12, 2019, from
https://www.wired.co.uk/article/reuters-artificial-intelligence-journalism-newsroom-ai-lynx-insight
Seth, C. (2016). Mapping the human–machine divide in journalism. The
SAGE handbook of digital journalism, 341.
The meteoric rise of the field of Artificial Intelligence (AI) has had a
remarkable influence on various aspects of our lives, and this influence is
only expected to rise. AI has already disrupted the field of journalism with
the introduction of “Algorithmic journalism” (Dorr,2015). Algorithmic
journalism involves a “software that automatically produces texts in
natural language from structured data.” Various economic reasons are
driving the rise of AI within journalism. First, AI spares journalists the time
to draft articles and news pieces that are relatively uniform such as daily
news reports about the performance of the stock market. AI’s use in editorial
tech helps writers and journalists review their pieces promptly. There’s also
an argument that AI may help reduce the biases in certain stories, but given
that the algorithms drafting the content may itself include the biases of the
person who coded them, this argument still has its flaws.
In its bid to enhance its ability to reap the fruits of AI in journalism,
Reuters has introduced an AI tool called Lynx Insight (Kobie, 2018). This tool
aims to augment journalists and writers rather than replace them by providing
them with analytical tools that synthesize big data in a way that nurtures
their journalistic role. Lynx Insight will analyze a vast amount of data to
identify any interesting patterns or topics that can allow Reuters the
opportunity to publish content that is innovative and pioneering, and at the
same time fits with the readers’ interests. Lynx Insight aggregates the data
and sends the journalist a message with a brief about any interesting patterns
with some background about the story or topic. The App associated with the tool
provides journalists with a live feed of updates regarding any possible
breaking news stories.
AI’s growing influence in the field of journalism may have significant
implications on the future of news and media. AI may help journalists
personalize the news according to the interests of their audience, which may
enhance the appeal of the news and its readability. Its ability to reduce the
cost may allow new news and media outlets to enter the field which supports the
democratization of the field and may provide a competition that can support the
quality of the content. Unfortunately, this competition may also lead to the
deterioration of the content with news outlets fixated on competition and
monetizing content rather than nurturing the field and improving its appeal.
Over-dependence on AI tools such as Lynx Insight may reduce the journalist’s
sense of agency and innovation ability. This dependence may be destructive to
the field of journalism if there are issues with the algorithm, or if the data
used by AI has significant flaws.
Kobie, N. (2018, March 10). Reuters is taking a big gamble on AI-supported
journalism. Retrieved February 12, 2019, from
https://www.wired.co.uk/article/reuters-artificial-intelligence-journalism-newsroom-ai-lynx-insight
Seth, C. (2016). Mapping the human–machine divide in journalism. The
SAGE handbook of digital journalism, 341.
Shorthand is a platform that enables simple yet stunning visual storytelling for journalists, artists, statisticians, and any storyteller looking to explore dynamic digital means of telling their tales. In a time when empathy and compassion often feel scarce, storytelling with tools like Shorthand re-engage the emotion of an often jaded audience through paced, intentional, and visually dynamic storytelling.
Over the course of my time in academia, I have become quite in touch with how little I know. Everyday, actually, the pool of knowledge, the bank of content of which I am aware I need to learn gets bigger and bigger. So, naturally, I try to absorb as much knowledge as I can just to combat the growth of that pool of uncertainty, but the rate of understanding is always slower than the rate It feels like a sprint, one where I can see the end, but the faster I go, the farther away the end gets. It is an absolute race to learn as much as possible as quickly as possible.
In that spirit of panic learning, I have become an avid speed-reader. I remember having a deep pride in my ability to speed read, to skim, to find the gold nuggets of information in a sea of text at school. The structure of the piece? I know it like the back of my hand and could find the heart of it blindfolded. Anecdotes? Fables? Stories? Merely obstacles on my mission to dig up the seed of ground-truth planted and hidden deep within the essays of the old men of antiquity.
But with so much practice in my race for information consumption, out of repetition, habit, and training, I have a really hard time not speed reading.
My group, the Lab for Social Machines, is working on a project called the Local Voices Network. It is constituted of a “unique physical-digital network designed to bring under-heard community voices, perspectives and stories to the center of a healthier public dialogue.” In short, we have a lot of audio of people telling stories from their lives. As a part of my research, I’ve been reading the transcripts of these people’s stories. Some are deeply personal, raw, and emotional. Yet, while reading, I’ve found myself flying through them, zooming through the details, feeling little empathy or any emotion at all, only looking at it through an academic lens racing to find the key nuggets of information. And what a disrespect and disservice to those storytellers.
I’ve found now, that when I listen to the audio of those stories, slow down, hear them word for word, hear the emotion in their voice, do I feel some emotional tug.
I believe that is a key problem with media consumption in American democracy today: often, we feel little empathy, no compassion, and no emotion when we read or see stories that should be truly moving.
Of course, how the story is told plays a primary role in the consumer’s interpretation and the emotion they feel. However, I believe the medium is also key.
In order to feel more empathy and compassion when taking in stories, I’ve tried to give more attention to the emotionally stirring mediums. I’ve found them to be longform, often audio or video based, more based in detail, characters and humans, images, key moments, and so on. In these formats, we humanize the people in the story, feel their pain, visualize their circumstances, feel the emotion in the voice of the speaker, and empathize.
In my experience, I have found it to be more rare for text based stories to offer that same punch, both due to my incessant speed reading and the sometimes one-dimensional nature of the text I read (often news, often academic, and often cold).
Getting to the Point…
Shorthand enables text based stories to paces the reader and allows for easy, efficient, but stunning and deeply impactful visual storytelling. The visual storytelling of Shorthand allows artists, data visualizationists(?), storytellers, journalists, scientists, and whoever to collaborate on teams to tell a story that engages the reader. This collaboration enables illustration, photography, video, and data visualization to be enhanced by beautiful and informative language, and enriches traditional text-based stories, pushing them into a second or third dimension of communication.
The slow and intentional spacing of a story segmented not by paragraphs but by the consumer’s scroll rate allow for the writer to place emphasis on a single moment, a single image, a single line of text in a way reminiscent of to oral storytellers when they hit the climax, a moment of suspense, or a key moment of loss.
No longer can you zoom through a moment, zoom through a visualization, take only what you want to from the peice. Rather, the writer has a bit more control over what moments stick out in your mind as important, influential, and meaningful.
I’ve attached examples of stories that use illustration to promote empathy and emotion in stories whos punch can be diluted by news outlets, stories that break down data visualizations into more consumable packages, moments where Shorthand has been used for advocacy, and a visual artist who has incorporated Shorthand into their art to create an array of stunning self portraits.
Finally, Shorthand is incredibly easy to use. I’ve linked one I’ve created about croissants here that took me less than 10 minutes. They offer extensive tips on general storytelling and how to use their tool on their page, The Craft, that is useful for those who use the platform as well as for those who choose not to. The platform is not free (but offers a free 30 day trial if you want to check it out).
Overall, I would highly recommend this tool and other tools and media like it to re-engage emotionally distant or jaded audiences to reinvigorate and bring passion, emotion, compassion, empathy etc. back to what can sometimes feel like a dying or apathetic democracy.
Searching twitter for only those tweets made in a particular time, in a particular location, is clearly a valuable tool. Twitter is a dazzling fountain of sources, and being able to tie those to a place and time provides context and reduces noise; it’s more likely that a journalist will be able to use the tweets they see in building a story
Geosearch has been around for a while; Echosec, present in a 2016 list of tools for journalists, is branded as a private security / “Open Source INTelligence” platform. With blog posts like “Social Media for Executive Protection” from 2015 and “How Executive Protection Services are Changing” from 2018, they’ve clearly found their niche, and since the time list of tools was written have stopped offering their tools to non-customers.
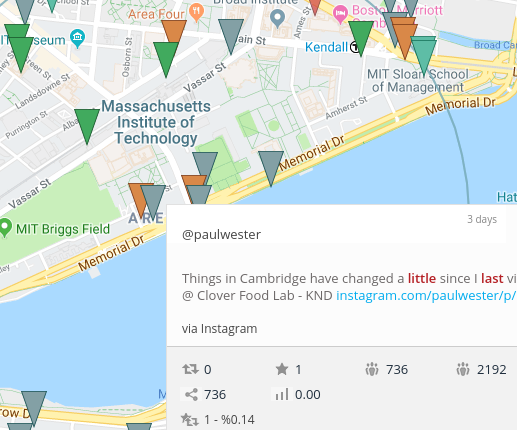
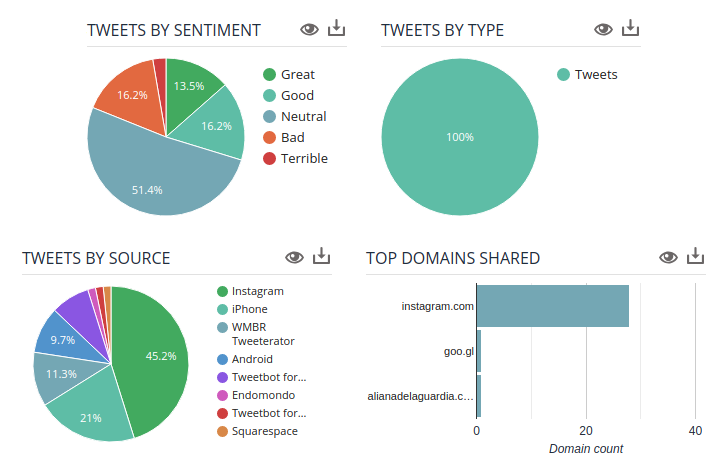
Socialbearing, on the other hand, focuses on marketing feedback; “insights and analytics”, “sentiment analysis”, and “View top influencers” are their key features. Google Analytics is a clear visual influence (see image). Their product, thankfully, is still available, and even makes some noise about randomizing location markers to protect privacy.
Journalists can obviously benefit from such tools in myriad ways, most obviously when covering chaotic live events such as a protest, riot, natural disaster, police scene, etc.. Historical searches provide a way to compare locations at a particular time, or track a location over time, providing the oppourtunity for spatially-rich narratives of an event.
But what are the implications of these tools? The breadth of interest in them, combined with the impression that they’re somehow more “real” than twitter (anything on a map is easy to imagine as having already truly happened), makes them an interesting vector for malinformation. Building a fake twitter account that could plausibly be in a particular location takes a different kind of work than your standard fake account, but it probably doesn’t need as many followers/follows to be noticed, and so may be more resilient to discovery attempts. Journalists using these tools may wish to practice a kind of “shadow analysis” to verify whether the incidental information of these tweets and accounts is sufficient to verify a highly spoofable GPS entry.
What I find most intriguing, however, is the perspective these tools offer to the user. By helicoptering the journalist over mapped landscapes and letting them look down to spot individual tweets, they make the user feel powerful, godlike. The world seems understandable, and certainly the streets are understandable in a way they wouldn’t be from the ground during a protest, riot, or natural disaster. While the journalist is already in a position of being at their computer and not on the ground, I feel like geosearches heighten that feeling of distance even more than looking at a stream of text does, and that concerns me. This flyover perspective seems like something that could easily creep into the tone of how something is covered, giving it a strong spin even in the absence of malinformation.
EDIT: this only occurred to me just now in class, but while I saw several posts on “drone journalism” which meant by it using drones for photography, this kind of investigation by signature strike truly seems like journalism coming from the tradition of the drone, with many of the same strengths, the same weaknesses, the same fraught tradeoffs.
The project brings together journalists and data experts to search, analyze and explore publicly available data to extract insights, facts and material to shape and back up their data stories. The YDS platform allows users to browse through and analyze datasets from various sources, which have been already aligned, interlinked and unified under a common vocabulary.
The simple visual approach of YDS makes it possible for journalists and less skilled data researchers to delve into the data from any possible aspect and perspective finding new angles for analysis and interpretation. The all-in-one workflow lets users go straight from finding the data to publishing their story.
YDS brings data from different sources together to complement and eventually enrich a story. Open governmental data sets can be used to tell interesting stories and reveal patterns related to public expenditure. It serves as a camvas that enables journalists and citizens to trace hidden stories in data. While still in a developing stage, the platform serves as a toolkit for journalists to identify, investigate and create news stories.
Find it at https://yourdatastories.eu
Here’s a funny thing about the Web: sometimes, secrets are hiding in plain sight. Indeed, when you browse a web page, you generally receive a lot of elements from its server. Of course, you generally obtain HTML and CSS markup, as well as Javascript code, but also a variety of other files like fonts or data sheets. Then the browser combines and interprets all of that data to form the page you are browsing. What you see on the webpage is only, then, the tip of the iceberg; but there is generally much more to it, and it’s sitting idle in your computer’s memory.
Often the rest of the iceberg is essentially worthless for journalism purposes. Sometimes, however, it can be crucial to access it. For instance, you could be looking at a visualization and you be longing to get the dataset forming the base of what you are seeing. Or you would want to remove that stupid overlay sitting between you and the paywalled content. As it happens, more often than you might think, you can circumvent it. (We’ll see how to do this later.)
So, today, I wanted to talk about a tool that allows you to do that; more crucially, if you are reading this now on desktop, it is probably just a shortcut away:

What you are seeing here is the Web Inspector. Some of you, probably, have heard of it, or used it; most journalists, maybe even the ones that are processing data, are not aware of its existence. A web inspector allows you to understand what is going on with the web page that you are visiting. It generally is organized around the same categories:
Let’s go back to the two scenarios that I laid out earlier, and use them as examples of how to harness these a web inspector for journalistic purposes.
Let’s take, for instance, this applet. Made by a French public broadcaster, it tracks the attendance of local politicians across France. You can search by name or region but, sadly, you can’t directly download all the data. This is all the more disappointing that the website indicates that their dataset has been done by hand, so you probably can’t find it elsewhere.
Well, with a web inspector, you can. If you open it and click on the network panel (and reload the page), you can see that there is a datas.json file that is being downloaded. (See the red rectangle.) You just have to click on it, and you just have to browse the dataset.

Now let’s take a second example. You want to go on a paywalled website, say, ForeignPolicy.com. You probably will end up with that:

Now, there is a way to actually read the article in a few clicks. First, open the inspector by right-clicking on the dark part of the page and selecting “Inspect element”.
You should probably obtain a panel with an element of the HTML already selected. You can just remove it by pressing the delete key.
The problem, now, is that scrolling has been deactivated on this website, so you can’t descend much further into the article. However, if you inspect one of the article’s paragraphs, the panel will display the part of the HTML file that corresponds to the article’s content. You can then expand every <p> (which is the HTML-speak for paragraphs), or right-click “Expand all” on the line above the first paragraph:

And here you have it:

It’s not the most practical way of reading an article, but it’s probably better than no article at all. (And to be clear, I’m all for paying for your content!)
The broader point is this: if you feel like you get stuck on a webpage, that a webpage is somehow blocking you to access a deeper level of content, the web inspector may be here to help. It is not bullet-proof, but, as we’ve seen here, it can sometimes save your research process.
In short, the web inspector is an underrated tool for journalistic research: it is already installed in every desktop browser, it is a de facto Swiss knife for web tinkering, and is not that well-known. To me, it may be one of the common tools of journalism in the future.
By Aaron and Drew
Online tools have the ability to lower the effort that journalists need to put into researching their stories. Lowering the activation energy can spur new types of journalists, reimagined forms of engagement, and entire communities centered around this new media.
MuckRock is a perfect example of such an ecosystem forming around a tool that made a previously burdensome task easy. Requesting information from the government can be daunting, but MuckRock guides you through everything and even digitizes what is otherwise often a snail mail process.
However, MuckRock is not just about requesting public records. It’s also about everything that comes after. People can track each other’s’ requests, report articles on the public records, and even crowdsource donations to support more investigative research.  (from: https://www.prx.org/group_accounts/190663-muckrock)
What is the Freedom of Information Act?
Lyndon B. Johnson signed into law the Freedom of Information Act (FOIA) in 1966. The law mandates the disclosure of government records to anyone who request them, citizen or not. There are a few exceptions to these record releases, such as national security or the locations of wells. In 2015, the government received over 700,000 such requests for information, of which approximately 25% were released in full and 45% were partly released.
The law mandates a response from agencies within 20 business days. Agencies are allowed to charge citizens for the time and materials.
The FOIA is a federal law that only applies to federal agencies in the executive branch. All 50 states and the District of Columbia have passed their own Freedom of Information laws that are generally very similar to the federal version.
What exactly is MuckRock?
MuckRock is a service for journalists to request and manage FOI requests from a variety of federal, state, and local resources. Since 2010, it has released more than one million government documents: http://www.bostonmagazine.com/news/blog/2016/07/03/muckrock-foia-turns-50/
How do you request a public record?
It’s great you asked! We wondered the exact same thing, so we went ahead and requested our own with MuckRock. The process is simple. All you need to do is sign up for an account, pay a nominal fee ($20 for 4 requests) and then make your request.
With our request, we have asked the FBI to release all records pertaining to foreign cyber attacks against American universities.
Muckrock tracks the average response times of various agencies. Here are some examples:
| Agency | Average Response Time | Required Response Time | Success Rate | Average Cost |
| Federal Bureau of Investigations | 130 days | 20 days | 21% | $2661.30 |
| Central Intelligence Agency | 156 days | 20 days | 9.5% | $28.30 |
| Department of Justice | 211 days | 20 days | 8.2% | Not Available |
| Massachusetts Bay Transit Authority | 84 days | 10 days | 38% | $2082.84 |
How do public records turn into journalism?
Once one hears back from the government with the information she requested, she can use the information in her reporting. Additionally, MuckRock writes its own articles using the public records surfaced by users.
This reporting has the ability to close the loop of the FOIA process and hold parties accountable for actions that might otherwise go unnoticed. Articles on MuckRock are often very timely. Some recent examples include “Boston Police underestimated size of Women’s March protests by nearly 150 thousand” and “EPA Transition docs detail many of the regulations Trump could roll back”.
In a departure from what you normally see in journalism, the articles are often centered around a piece of evidence, such a police report, FBI file, or government document. Not only is the evidence there for you to see and inspect, you can look up the history of how and where it was obtained.
This has the ability to change how readers interact with the news they’re consuming. They can inspect the evidence themselves, forming their own judgement, and even develop ideas on how they may further the reporting in the future — transforming them from consumers into producers. It also introduces transparency that can help instill confidence in the media.
Who funds all this?
Individuals can request their own public records (like we did!), thus supporting the MuckRock community through these one-off records. However, they can also help fund larger projects that are centered around a particular topic and requiring substantial funding. In this sense, MuckRock serves as a crowd-funding website.
Example: https://www.muckrock.com/project/the-private-prison-project-8/
The need for data visualization
With the growth in trend of buzz words like big data, data science etc, the general interest in expecting data as proof is becoming the norm amongst readers. Additionally, growing popularity of blogs like FiveThirtyEight, reporting is slowly moving towards becoming more data oriented. Therefore, the onus now lies on the media content producers to use advanced data analysis to make their points. However, analyzing data is complicated and even harder to communicate but could be done effectively by using data visuals.
Conducting my research on the topic of easy data visualizations, I noticed that majority of the recommendations revolved around using programming languages like R, python etc. Learning how to code is a mammoth task for writers whose main focus is on researching and delivering the story and not learning how to code. Writers need a tool that helps them analyze data and build visuals with a few clicks. A tool like Plot.ly.
What is plot.ly?
Plot.ly addresses the user challenge of creating data visualizations without having heavy knowledge of programming and data visualization techniques. Plot.ly’s website and blog showcase a number of samples on how leading news sites have used Plot.ly visualizations in their articles. For example, below is a sample visual showing statistical analysis in a NYTimes article:

Source: NYTimes 2014 Article – How birth year influences political views
Some of my favorite tools on the platform (image below) are:

What does data visualization mean for advancing journalism?
In my opinion, I think Plot.ly helps advance journalism and storytelling by:
Plot.ly resources
Multiple tutorials are available on the webiste. From creating charts to data analysis using sample data sets.
I already know. Twitter is not the newness. But that’s why I’m taking this class – to discover new tools and think differently. In the meantime, when I’m on deadline writing three columns a week, sometimes I feel like this:

But Twitter’s Advanced Search often comes through in a pinch. When there’s a breaking news story in the #blacklivesmatter movement or something trending in underserved communities, Twitter often has the news first and Advanced Search allows you to zone in on specific dates, people and even geographic location. You can search by specific tweeters, hashtags or general phrases making it easier to source, fact check and connect. That makes me as happy as Solange when you don’t touch her hair. Don’t touch mine either.

If you were tasked with reviewing and making sense of a huge stack of documents you’ve never seen before, you would probably go about it in a pretty standard way. Skim the first page and make a quick decision about whether it’s relevant or about a specific topic, then move to page two and make that decision again. After a few pages, you might have a few separate piles describing what you’ve seen so far.
As you continue reading, the piles might get more sophisticated. In one pile, you might place emails containing specific complaints to the school board. In another, policy proposals from a public official’s top adviser. On and on you go until you get through enough of the pile to have a fairly good idea of what’s inside.
For investigative journalists reviewing massive document dumps — responses to public records requests, for example — this may be one of the very first steps in the reporting process. The faster reporters understand what they have, the faster they can decide whether there’s a story worth digging into.

Overview, a project to help journalists sift through massive document dumps
Making sense of documents as efficiently as possible is the primary purpose of Overview, an open-source tool originally developed by The Associated Press and funded by a collection of grants from the Knight Foundation and Google, among others.
Upload your documents into Overview and it will automatically process them first using optical character recognition. It then uses a clustering algorithm called term frequency-inverse document frequency to try to sort each individual document into a series of piles. It’s somewhat similar to the way a human reporter would sort documents if she were reading the pages one by one.
TF-IDF is built on a really basic assumption. It counts the number of times each word is used in each document — say a single email in a batch of thousands. It then compares those counts to the number of times the same words are used in the larger collection of documents. If a few of the emails have words in common that are relatively uncommon in the whole collection of emails, the assumption is that those documents are related in some way.
Overview doesn’t actually derive any meaning from the words it’s counting, so the assumption the algorithm makes about documents being related might be wrong or totally unhelpful. But Overview also allows users to tag individual documents (or whole piles) with custom labels. It might, for example, help a reporter more quickly identify those complaints to the school board or the policy proposals to the public official because they’re all grouped together by the algorithm.
Overview has a few other helpful features, like fast searching and the ability to rerun the clustering algorithm with different parameters — specific terms of interest or stop words, for example. It’s also seamlessly integrated with another tool called DocumentCloud, a popular platform journalists use to annotate and publish documents online.