To keep track of my media content, I used two methods. The first, Rescue Time, to provide a complete look at my online activity and desktop work. That way, I can compare the time I spend reading the news versus getting work done. The second method was much more on the experimental side. I manually recorded what I classified to be ‘news’ as I read it. Although this week isn’t representative of other, more normal weeks, the data probably fits and overall trend in my media habits.


Above is a short summary of my ‘productivity’. Reading the news seems to occupy a fair share of my time, even rivaling ‘entertainment’ which encompasses youtube and spotify (both of which are often used to provide better environments for concentration).
What’s the most interesting part of exploring Rescue Time’s tracking is that I saw very obvious patterns of activity for myself. I know that I tend to tab over to Facebook, Reddit, blogs, and news sites for brief periods throughout the day but seeing how much that adds up is interesting. I’m not sue I care enough to curb it yet – more data needed on how much it helps me de-stress or just plain distracts. It’s also quite consistent throughout the week although none of the ‘tabbing-over’ is planned in any fashion.

I’ve also learned that I although I feel like I spend the most time on Reddit, I’m actually on Facebook nearly twice as much. Perhaps because the content feels less interesting on Facebook? Reddit’s use of imgur as the image hosting site of choice must also be taken into account as I’m on imgur about 40 minutes per day, rounding my total true Redditing time to 3 H 10 M. Shame on me. Hmmm, however, I know for a fact that I’m on my phone Redditing often while waiting for the bus/train/unicorn so maybe not so much shame?
Given that I’m apparently on email about 8 hours a day (I do actually nearly compulsively check email), it’s not a surprise that a number of my news sources are actually through email. (See Media Diary link at bottom).
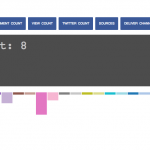
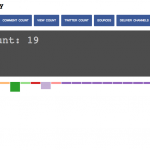
With the information I’ve collected manually, I’ve created a visualization to better understand how my media affects me and where I’m actually getting it (email, Facebook, etc.). Although the visualization needs a few more hours of work, it did help me realize that I’ve been getting my news a lot more through Facebook than I expected. I can further explore my visualization and see that I’m often on BostInno.com. This is a pretty decent highlight of Facebook’s role in news in general. Because Facebook is so good at the localized, personalized stuff, hyper-local news service might be a large part of their news pool. At least, it seems like that for me.
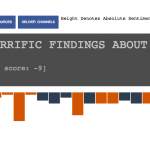
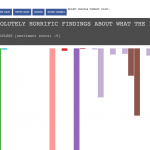
Within my visualization, I also included sentiment (using the ‘sentiment’ node package to compute sentiment scores), comment counts, tweet counts, and facebook share counts as a way to see what type of material tends to be shared (negative sentiment versus positive sentiment). Although these visualizations need some more work to get them to that stage of descriptiveness, they do provide some insight into what I prefer to read and how often I am made to feel ‘bad’ by what news I read online.
Obviously, I need to look at more world news – Boston-based news occupies much of my news reading. I need to reclassify some activities on Rescue Time. I also need to limit my Facebook tab-overs – maybe switch it to BostInno since I clearly go to Facebook for their news most of the time anyway. (Link to website with visualizations coming very soon) EDIT: link is here!: https://media-diary.azurewebsites.net/ Click on buttons (preferably going from left to right because there are bugs . . .) to navigate to different views. A short description exists next to the buttons to somewhat explain the graph. Click on bars in the graph to see additional info.