Interactive Graphics that Invite Participation

Participatory interactive graphics(?) are visualizations that are designed to change around data from individual readers. These graphics use information solicited from the user or the user’s computer as a lens through which complex data or very general data is presented. This kind of interaction is increasingly important in storytelling.

Here are 3 types of stories I have come across that fall into this category.

Screen Shot 2016-02-09 at 11.05.57 AMScreen Shot 2016-02-09 at 11.48.17 AM1. Calculators and searchable interfaces – These searchable or adjustable interfaces allow users to glimpse the larger underlying system by answering each user’s targeted questions. Examples: “How The Internet* Talks” and “Is It Better to Rent or Buy?”

Screen Shot 2016-02-09 at 11.22.38 AMScreen Shot 2016-02-09 at 11.22.51 AM2. Draw your own/quizzes – Soliciting educated guesses of trends from users to involve them in thinking about the logic behind trends and increase impact. Example:  “You Draw It: How Family Income Predicts Children’s College Chances“ 

Screen Shot 2016-02-09 at 11.18.35 AM3. Geolocating Users – Using ip addresses to geolocate users and automatically alter the view and accompanying text of the visualization to be centered around a user’s location. This is used in navigating general and comprehensive datasets that cover the whole country but are only of interest to most readers as smaller slices. Example: “The Best and Worst Places to Grow Up: How Your Area Compares” 

I think these types of interaction are not only an important tool for storytelling online, but can affect larger patterns for reading online for several reasons.
1. They might be more readily shareable across social media because of how specific they are to the interest of a reader.
2. Commenting is problematic on many online articles. I think using this specific type of interaction can potentially serve as a filter for comment reading, and provide constructive directions for comment writing and discussion among readers.
3. Finally, this kind of interaction could serve as a dynamic filter for customizing out links from the article and effect recommendations.

There are discussions to be had on whether the data gathered from interacting with graphics should be used for purposes of catering content. I’m not sure yet how I feel about editorial decisions that might be increasingly challenged by the metrics of social media and how this addition contributes to the discussion. I would like to know more about how feedback is currently weighted in the newsroom. Ultimately, this interaction may result in more stories being force fit into a data-centric model that is less good than what we have now. There are also definitely issues with the quality of the data being gathered from this type of interaction, which is an interesting area of study once there is a large enough sample size.

I do believe experimenting with this type of input is ultimately worth it and could change the way we look at readers and frame select stories in a positive way. Actively using reader input is a important concept for storytelling. It is not new, but it is adoption within interactive graphics has presented very exciting recent use cases and it is a topic that I would like to explore further.

Civil Comments: A New Way to Create Civil Online Conversation?

The tool I’m interested in is Civil Comments.

How it Works

Their video offers a great overview of the system.

Civil Comments – How It Works from Civil Co. on Vimeo.

Why It’s Interesting

The Civil Comments tool provides an interesting intervention in the comments space, because it offers a unique but also intuitive answer to some of the key problems facing online content publishers when it comes to their comments.

  1. The Expense of Moderating, Especially at Scale – many content publishers currently face a huge problem when it comes to moderating comments. Most moderation requires a human editor. Although many tools will automatically filter out abusive terms, it still takes a human moderator with judgment (and maturity!) to read user-flagged comments. For publishers who deal with heavy content volume, human moderation can be very expensive. By leveraging the power of the audience, Civil offers to make comment moderation free, and scalable. This is huge. The Civil interface is also pretty simple – it looks a lot like TripAdvisor’s or Amazon’s ratings, which are proven interfaces that people like to use.
  2. Limiting incentives to abuse – the most thought-provoking claim that Civil makes is that they’re able to single out abusive commenters through this crowd-sourced system. I’m not entirely sure if that’s the case, but their initial run with Willamette week appears to have garnered some positive reviews. Although untrained folks may NOT always be able to filter out abusive comments, this crowd-moderated system raises some interesting questions about the incentives to post uncivil commentary. If comments are social, as many people (including Joseph Reagle of Northeastern, in his book on the topic) have suggested, then that begs the question: if only 1 or 2 people at most are going to see an abusive comment before it gets buried, will trolls even want to post abuse in this kind of system? Is the incentive to abuse lessened when there’s no audience? When it comes to mass troll attacks, Civil claims they have a system that will detect them.
  3. Hierarchy? Values? By enabling a form of peer moderation, it’s possible that publishers who use the Civil system will send a positive message about the role that their community plays in setting the site’s values. It also marks the comment section as an independent space, one where both readers and journalists get to set priorities. At the same time, because readers get random comments to review, this peer moderation system might offer ways to avoid some of the bias (towards highly ranked commenters, towards familiar commenters, towards early comments) that other peer moderation systems are prone to (Lampe et al).

What it Won’t (Necessarily) Do

  1. Eliminate issues of site-wide bias: Many moderators of peer moderated sites whom I’ve spoken to have mentioned that their sites have a particular political bias. I don’t see that Civil will address site-wide bias very effectively, especially considering that people tend to moderate comments more favorably when those comments reflect their own views.
  2. Invite minority views/communities into conversations. One of the moderators whom I spoke with offered a compelling case study of how their site had drawn flak from trans members about transphobic language. The moderators made an executive decision to change community norms, and enforce those changes, even though the majority of site users weren’t as affected by the issue. Sometimes moderators might want to enforce values/etc that the community does not. How are these more subtle social norms introduced? How are they maintained and shown to new members who are visiting for the first time? It seems like the initial judgment made by the crowd might be a large-grained filter at best, and exclusionary at worst.
  3. Protect identities and data. Conspicuously absent from the Civil Comments’ webpage: any mention of what happens to users’ comment data. Civil says that they offer analytics, which means that they must collect data or offer a data collection option. But publishers run their own ‘instances’ of Civil. How are those data stored and anonymized? Who has access? Will Civil turn around and sell that information? Particularly relevant in conjunction with point #2, but problems of online harassment in general.

my news spaces


My News spaces:

Mine Gencel Bek

The graph attached at below titled news spaces shows my differing news consumption according to the lines of geography, themes and identities. The separation is made for analytical purposes and may not reflect the real percentage values. It is possible to say that I do consume the news mostly on Turkey and the local (Boston. Cambrige) though. My US news consumption, the last one, I believe is less as the world news. It depends on the conjuncture though. Still, it is a tough finding I find difficult to face though as someone who is supposed to negate nationalism and value the other nations politically. Truths hurt! Still self-reflexivity is a must for an academic, I believe. So nothing to feel shamed about to share with you.


The graph also include information on my identities. As a world citizen and journalism scholar, I tend to read political and academic news. Nieman lab news is the one I certainly follow everyday regarding the news industry in the US and the world.


There are of course other media I consume but here I mentioned only the most regular ones. At the moment, it is just so unbearable to follow the government supported media every day, for example. Therefore I stick to t24 news. That is also because of the fact there are a lot of news every day in Turkey.


My local news consumption also involves politics but still mostly related with being mother and consumer. I follow some free websites to find out activities for my daughter during the weekend mostly.


news spaces
This is also what came out from rescue time:

Over the past week, you logged:

13h 42m

Your productivity score:

55%

very distracting! neutral productive very productive!
Very distracting time!

Very productive time!

Most of your time went towards:

26%
Communication & Scheduling
20%
Design & Composition
17%
Uncategorized
13%
Reference & Learning
11%
News & Opinion

It seems that gmail takes a lot of time but it is not only talking and networking as recscue time coded. I receive RSS from many newsblogs and I read though g-mail. So. g-mail finding is not so bad.


Top applications and websites:

3h 16m
Gmail
1h 20m
PowerPoint
1h 3m
Adobe Reader
1h
Google Docs


Information Diet

I view myself as somewhat of an information glutton.

There is a constant explosion of information from various avenues (Social Media, Listservs, Emails, and Meetings etc.) on any given day. I have been mindful of the some of the associated consequences of our current way of life – from being unproductive to not being completely “present” at our real-world interactions.

So tracking my information consumption was a way to comprehend some of my interactions with information.

For the purpose of this week -long study; I have only included information that I really read or watched. I did not include the Bollywood movie that I watched over the weekend.

The four main categories that I tracked my “information Diet” under included news themes, type of media, sources and origins of information

My Information Diet

As you can see, there are a lot of things going on here; but below are some insights on my information consumption habits and engineering solutions to potentially address some of my particularly knotty habits / practices:

Filter Bubbles
This Ted talk on “filter bubbles” by online organizer Eli Pariser explains how algorithm driven personalized curation of online data can lead to an information junk diet. This pattern of information consumption only reinforces our narrow view of the world which can be harmful to the society at large. He argues that we need to encounter opinions that could challenge and expand our worldview.

A large part of my news consumption seems to revolve around my work projects and other interests. It would be interesting to have a plugin or app on my computer that can create some random variety in my information diet.

Media Bias Review Tool

Having worked in Media over the last few years , I think I have become innately suspicious about every piece of news and the inherent biases within it. If I really care about a particular piece of news, I will view it from various sources. I would love to have a browser plugin that can automatically bring up the same story from various sources along with a social / collaborative notepad to discuss subtle differences in coverage of the news and representation of facts across different news agencies.

ps: I am unable to upload media.So I have a link to Slide Share for my Information Diet presentation . I am getting the following error- ” Unable to create directory /var/www/partnews/wordpress/wp-content/uploads/2012/02. Is its parent directory writable by the server?”

What goes into, comes out of my brain?

Last Wednesday, immediately prior to attending an event on media diets, we presented a week’s compilation of our own media diets. The day’s scheduled events were rather meta with regards to conscious information consumption, and this turned out to be, in many ways, a theme of my diet.

Not counting this assignment, other meta media experiences included:

  • Watching The Matrix with a comedic audio track overlay
  • A Twitter feed following over 1,600 people and organizations, many of them political operatives operating in and around the day’s headlines
  • Watching Saturday Night Live lampoon the week’s news
  • A substantial period of time attending classes on particpatory news and social television habits

My Media Diet

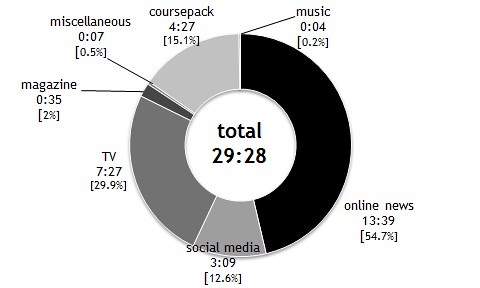
As you can see in the chart above, I aggregated the elements of my media diet into five categories (left to right):

Traditional news consisted of news websites and print magazine subscriptions:

Relaxation and entertainment included reading blogs, listening to music during workouts, and watching streaming TV shows on Hulu:

Creative production included writing, notetaking, creating graphics, and giving a presentation:creative production diet

Focused learning included conducting research, learning to code, watching tutorials, and listening to lectures:

Social intelligence included Twitter, Gmail, Facebook, instant messaging, and extended face-to-face conversations:

Lean-Forward Information Consumer
I’ve long been an early adopter and devoted Lifehacker reader. I install and try out most of the programs, plugins, apps, and web services that cross my path. I’ve chosen lean-forward interaction over lean-back entertainment since I’ve had access to a modem. As a result, I’ve spent a lot of time thinking about how to strike a balance between the potential of digital media and the warmth and history of analog media. And yet there were still a number of surprises gained from obsessively tracking my habits for a week.

Protect Time to Create
Arguably the most disruptive feature of participatory media is that it asks us to write information as well as read it. If consuming media is like consuming food, the metaphor extends to suggest that we consider the creation of media to be a form of exercise. Writing, coding, filming, and otherwise producing original content requires us to flex our creative muscles in a different way, similar to the shift between passively learning a field and actively teaching it to another person.

I was pleased to see how much time I spent actively creating content over the course of the week. My first semester at the Media Lab made it quite clear that it was possible to spend most of one’s time attending really interesting panels and classes, and reading an endless supply of academic literature, organizational reports, and course readings, all at the expense of producing any original work oneself. The limits imposed by time regularly force a decision between the immediate benefits of listening to someone much smarter than myself, and the longer-term journey to build my own skills and enunciate my own thoughts. I credit my group’s encouragement (and occasional mandate) to blog frequently.

Status Update as Atomic Unit of News?
Melissa Mayer of Google defended Google News’s aggregation of content by pointing out that the article has become the atomic unit of the news. Looking over my RescueTime reports, it became clear that sitting down with even an article or full blog post has become a somewhat rare experience during the week. Most of my dedicated news-reading time came during the weekend, like other leisure activities. The many interesting links Twitter tempts me with throughout my work day are bookmarked with a ReadItLater extension, and then automagically whisked away to wait for me on my Kindle, thanks to a recipe over at ifttt.

This is not to say that I am not aware of the news during the week. I spend most of my days actively plugged into what’s happening, but this information comes to me via Twitter, Facebook, and status messages on Gchat. It’s been written elsewhere, but the combination of real news and social intelligence is a killer combination, one that routinely crowns Twitter my most-consulted news medium. And, if awareness of the top Google Trends is an indication, these sources effectively keep me informed.

Absolute Time vs. Interrupted Time
For the value it provides as a social utility, Facebook really doesn’t take up much of my time each day (only Pages viewed8-10 minutes a day, spread out over more visits than I’d like to admit). That said, it was clear in my diary that tracking with tools like RescueTime won’t measure the true distraction of applications like Twitter and Facebook, or the time spent on my phone. The total amount of time spent on these social networks is relatively low, but quick consultations ensure they influence large blocks of time throughout the day.

One way Twitter influences my day more than the accumulated minutes suggest is in its role as provider of clickworthy links. Both RescueTime and my browser history show a large sample of quick hit webpages where I spend under a minute. This is common behavior for users across the web, but I was a bit surprised at just how many pages (over 2,400) I navigated through in a week.

Conversation as Information Medium
email dietEthan hinted that, if we took our media diet tracking far enough, we might begin to consider conversations as a form of media. I decided to go with it, because despite the success of social media platforms, we still receive much of our intelligence in regular conversations with other human beings. I already knew, thanks to Fitbit, that weekends are much healthier for me, as I walk and sleep more. Tracking my media diet showed me that weekends are also healthier for my social soul, as I spent much more time in face-to-face conversations.

Lastly, my email inbox was an interesting source of information. A small army of Gmail filters protects my actual inbox, but I still pick up a fair amount of news about political and social campaigns from a wide range of newsletters and listservs. As a result, I currently receive over 14 times more email than I send.

Bar chart color scheme by The Cooler shared under Creative Commons BY-NC-SA license. Icons by The Noun Project shared under Creative Commons BY 3.0 license.