Health and Wealth in Singapore

I approached this assignment with a data-first, narrative second perspective. I work on developing strategies for combating vector-borne diseases so the allied fields of epidemiology and geography seemed like a promising place to look for a story. One of the major vectors for diseases that affect humans (i.e. Zika, dengue fever, malaria, chikungunya) is the mosquito. There are several different kinds, but for the most part, they share a common taste in habitat. Places that are close to water, particularly stagnant freshwater, and get warm (as low as 60F, but ideally 70-80+ F) As I poked around the web trying to find workable datasets with this in mind, I came to find well-indexed mosquito and vector-borne disease maps from Singapore, provided by the government. I used Google MyMaps to create layers on this map that you can use to toggle between the overlays and I’ll walk you through some of the highlights.

One of the first things to know about Singapore, from an epidemiological perspective, is that it’s dense. There are over 5 million people living in an area under 300 square miles. Its the third most densely populated country in the world. While its very prosperous, it also faces a high level of income inequality — more unequal than the US and on par with Equador and Saudi Arabia (according to its Gini coefficient).

There were over 3000 cases of dengue reported in Singapore in 2018 an while the government maintains a high level of engagement in managing mosquito populations, the problem remains endemic. The National Environment Agency provides records of the location and number of reported dengue cases over a 14 day cycle, the last of which ended on November 7th, 2018.

This is a heat-map of the clusters of dengue fever in Singapore. The areas that are blue-green are clusters in the single digits and the double digits are in orange and yellow. We can see that cases not evenly distriubted throughout the country and most clusters are within a mile of another cluster.

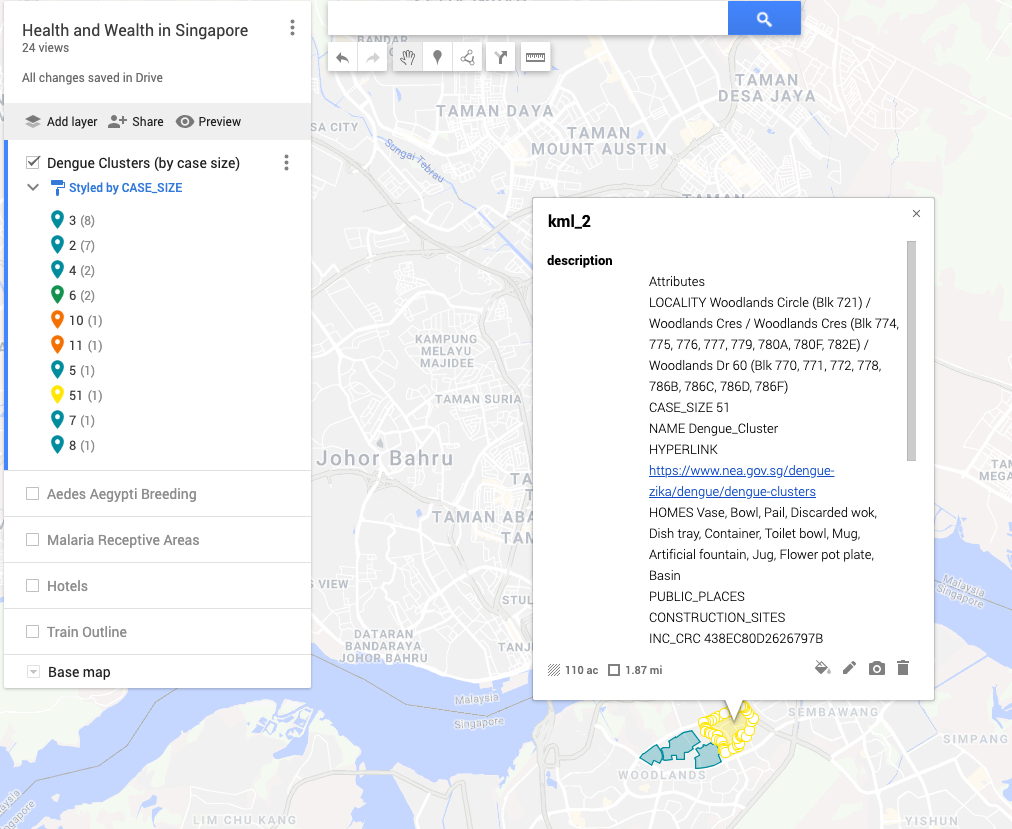
Zooming in on the largest cluster, with 51 cases (just under half of the total of all sites), we can see that the areas of stagnant water (where mosquitos breed) were found exclusively in homes. Water collects in every-day, household-objects, as is does in public places and construction sites. It seems personal homes, perhaps due to lack of knowledge, are the entry point for the spread of the disease. This is a question we can explore further by looking at where the breeding sites for aedes aegypti were found in the graph

Overlaying the aedes aegypti breeding sites with the dengue clusters, something interesting pops up — the graphs don’t match. While there are breeding sites in areas that there are clusters, there are not clusters everywhere there are breeding sites. This is interesting because it indicates that there is something going on, education, norms, or otherwise, that is breaking the line of transmission in these areas. But, you could say, maybe what we see in the breeding overlay is actually a representation of all the areas where aedes aegypti mosquito breeds and not all mosquitos have the virus responsible. In which case, the next map to look at would be the overlay of the areas receptive to malaria

In the above map, the “natural” habitat suitable for the malaria vector (anopheles gambiae) serves as a proxy for “natural” habitat suitable for aedes egypti. This overlay shows that a large portion of the mosquito breeding sites are, in fact, outside of the malaria receptive areas. While this map can party be explained by a lack of sampling depth for breeding grounds in the receptive areas, the fact remains that areas that were not expected to be breeding grounds simply are. Life in the Anthropocene for the mosquito is booming.

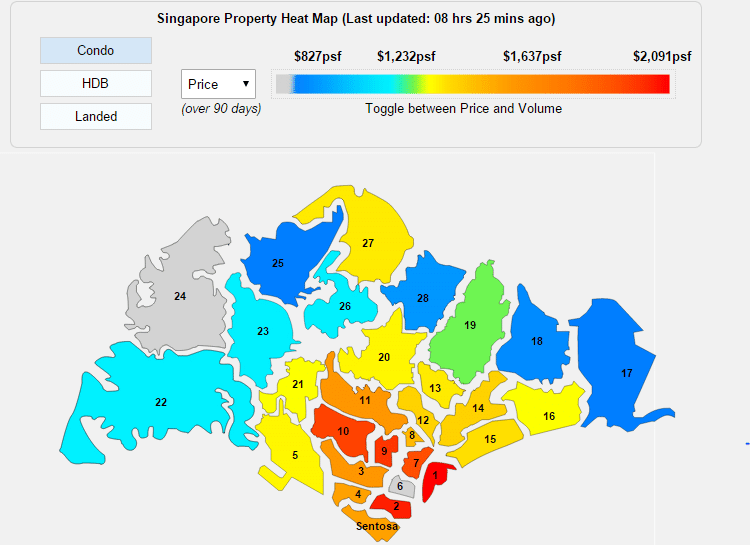
Taking a step back and looking at the dengue clusters in relationship to the hotels, we can get a sense of the places that tourists are likely to be. This can serve as a proxy for areas that might be thought of as desirable. It surprised me to see that while there are some clusters close to hotel locations, the hotels seem to carefully avoid them. I was then interested to delve into looking at how sharp the economic divide might be at those borders. While I wasn’t able to find data that was easily transferable into the format of this map, below are two maps that can give some insight. The first is of the train-system throughout Singapore and the second is a property heat-map. I chose to look into the train system to see if there was a relationship between transport hubs and dengue clusters in terms of 1) disease mobility and 2) if economic centres (well-serviced by transit as a proxy) faced the same intensity of disease compared to less economically active areas. While perhaps useful, these might be questions that are beyond the scope of this assignment. The property heat-map can give some more understanding of where the affluent and economically disadvantaged live.

Bajaj, Abhishek. (2015). Exploring Urban Poverty in Singapore A lens on the influences acting on a child growing up in a lower socioeconomic environment. 10.13140/RG.2.1.4880.7767.

Death by Compounding

Jason and I collaborated on this and he’ll be writing up our final blog post; in the meantime click the image above to go to an interactive visualization of pharmaceutical compounding errors in the US!

Visualizing the West Virginia Opioid Crisis

Having just returned from two weeks in West Virginia working on an economic development project in Appalachian downtowns, I was interested to look at opioid death (easier than use) statistics by county. However before getting into the data, it’s worth taking a look at one generalized take of regional differences in the state.

Annotations based on interviews with community leaders across West Virginia.

With these regions in mind, opioid death rates are particularly stark.

Data is from CDC Wonder database. Grey counties do not report opioid deaths.

This “Southern Coalfields” region clearly shows a significant opioid problem, and is moreover economically depressed (as seen below). Opinions among community leaders in the state differ on how government and community institutions can and should address the problems in southern West Virginia.

Source: 2017 American Community Survey.

From its history as a leading coal mining state, West Virginia is struggling to re-invent itself as an outdoor tourism hub and an exporter of timber and natural gas. However to support this redevelopment effort, West Virginia needs a healthy workforce. How federal, state, and local institutions respond to maps like the above will define whether West Virginia can successfully navigate a post-coal economy.

Well, Butter My Biscuit! Baking good biscuits knows no geographic bounds

American biscuits are known for their simple ingredients, humble origins, and delicious buttery flavor. Contrary to some opinions, they can be made anywhere in the US with enough attention paid to process and basic, not-so-special ingredients.

The hot topic of 2018 (discourse on which triggered by a well intentioned Atlantic article) was the flour used to make the biscuits. True to their low maintenance form, biscuits quire a low-protein more-refined flour: all purpose flour, the most accessible throughout the US. This flour enables a flaky, crumbly texture, closer to a pastry or croissant (optionally made with pastry flour) rather than gluten-full bread (bread flour). For a more delicate texture (but not necessarily more delicious or authentic), you could mix the AP flour with pastry flour.

Next, cold ingredients are key, especially the butter. If the butter is not icy cold, it will combine completely with the other ingredients, and an over mixed dough will lose the flakiness and lightness moisture and fat pockets provide.

Finally, one must not work the dough for more than 10-20 turns. Too much more would melt the butter, over mix, build too much gluten, and toughen up the dough. Rather, once the dough is mixed enough so there are little flour pockets but there are still clear little chunks of butter, roll out the dough and cut out circles using a jar lid or glass. Place on a lightly buttered pan and bake!

As an eager and experimental baker, I love a good baking challenge. So when Amanda Mull of the Atlantic wrote the article that inspired this piece, “Why Most of America is Terrible at Making Biscuits,” I had to test to see if her claims were true. Was most of America terrible at making biscuits? Was I not up to the challenge?

I tested her hypothesis. On first try, my biscuits were terrible and I subscribed to her statement that White Lily flour, not available in most of the US, was key. Upon a second attempt and some follow up research inspired by this NPR article, found her claims to be false.

Elizabeth Warren on Confederate Monuments, via Breitbart

I fact checked a Breitbart piece documenting a Jake Tapper-Elizabeth Warren interview in which Warren agrees with Tapper that Mississippi should change its flag.
My fact-checking annotation of the article, via Bounce, is here. The CNN piece on which the article is based is here.

Perhaps the most interesting thing about this exercise was that the text of the Breitbart piece is not factually incorrect (most of it is verbatim quotes from the CNN piece that broke the story). But the title is vastly misleading. There is a big difference in Warren agreeing with a statement made by Jake Tapper and saying “Get Another State Flag”

Turmeric Tension

I fact-checked a recipe from the popular wellness website Urban Remedy. Their current spokesperson/celebrity figurehead is Cindy Crawford. See my bounce annotations here.

Turmeric, which contains the chemical curcumin, has been the subject of a rather major theoretical flaw in the field of medicinal chemistry. See this opinion piece in Nature.

Climate Delayism

Climate change is an issue that needs to be addressed now.

Global greenhouse gas emissions need to start declining now to reach the 2°C goals to avoid the worst effects of climate change.

Source: Climate Action Tracker

195 of 196 state parties signed the 2015 Paris Agreement with the aim of “Holding the increase in the global average temperature to well below 2°C above pre-industrial levels and to pursue efforts to limit the temperature increase to 1.5°C above pre-industrial levels, recognizing that this would significantly reduce the risks and impacts of climate change” [1].

Although communication of climate science has been able to refute falsehoods used by denialists, a new group of “climate delayers” is trying to forestall regulation by downplaying the urgency of climate change and role of regulation.

The Cato Institute, a well-funded think tank with a history of climate change misinformation, claims that there is “ample time” to develop technologies necessary for emissions reduction.

Climate delayers may make similar claims to stall progress on climate change in order to maintain their (or rather their anonymous funders’) profits. For example, the Cato Institute was founded in part by Charles Koch, whose wealth largely originated from oil refining and chemicals.

Reporting as Curation: Nebraska Flooding

This year has been one for the record books in Nebraska — at-least meteorologically . As the Omaha-World Herald reports, the period between September through February was the fifth-wettest fall-winter on record, this February the eighth-coldest on record. Thats not to mention that this recent deluge is responsible for Nebraska’s worst flooding in 50 years.

This flooding is due to a bomb cyclone, the meterological equivalent of a bass drop. When a low pressure system drops at-least 24 millibars in 24 hours, it undergoes the rather terrifyingly named explosive cyclogenesis. This pressure drop makes the ensuing storm stronger and can even approach a category 1 hurricane in terms of wind and rain.

As the waters recede, Its hard not to notice the how utterly un-drivable many of the roads underneath are. And it seems that this is not just the case of a single storm’s damage but indicative of a legacy of poor infrastructure management.

But it seems that this is part of a larger narrative of how poorly infrastructure has been managed in Nebraska recently. Take, for example, the snow storms of this past season:

In the heightened national attention, perhaps pressure to fix the roads will finally lead to serious investment. As it seems, the current government is slow to admit fault and responsibility.